filmov
tv
Import Copernicus climate data via API, process netCDF and map with ggplot2

Показать описание
This tutorial shows you how to access Copernicus Climate Data Store API through KrigR package in R, retrieve climate data in netCDF format, and create powerful static and animated visualizations for any country in the world using ggplot2 and gganimate
0:00 Prologue
0:50 Intro
02:03 Set working directory
04:14 Install KrigR
06:06 Load libraries
11:59 API id & key
12:49 Copernicus Climate Data Store
18:08 Registration
20:32 KrigR - documentation
26:12 KrigR - build query
32:32 KrigR - download data
33:55 netCDF
37:43 Plot June 2022 temperature for Poland
41:32 Quick & dirty map
42:51 netCDF to dataframe
44:46 Pivot dataframe
47:25 Create dates from layer names
57:35 Breaks
01:02:10 Spectral palette
01:06:22 ggplot2 code
01:14:17 ggplot2 theme
01:21:26 Panel map of poland
01:22:39 gganimate
01:29:31 Save map as gif
01:30:13 Timelapse temperature map
01:31:33 Closing
Check the full code in my GitHub repo:
Follow my work on Instagram:
Let's connect on Twitter:
If you like my work, consider buying me a coffee:
Music credits go to:
David Hyde:
Music provided by RFM
 1:33:00
Import Copernicus climate data via API, process netCDF and map with ggplot2
 0:05:43
How to easily download multiple years of climate data from the Copernicus data store using python?
 0:08:10
Data Discovery – Sources of Climate Data
 0:20:41
Download ERA5 reanalysis from the climate data store
 0:08:51
How to download ECMWF weather and climate data for free | Step by step guide | Climate data | Python
 0:02:45
Introduction to the Climate Data Store and Toolbox - Downloading data
 0:04:45
How to Get ERA5 Climate Data Using Python
 0:11:41
Using the python CDSAPI to access the climate data store
 0:07:13
Download climate data using CDS API Python | geodev | tekson
 0:01:24
Introduction to the Climate Data Store and Toolbox - Searching for data
 0:02:00
Introduction to the Climate Data Store and Toolbox - Registration and login
 0:03:11
GloFAS data on Climate Data Store (CDS)
 0:42:32
How To Download and Make Time-Series From ERA5 (ECMWF) Dataset
 0:07:00
caladaptR Demo: Import and Plot Climate Data
 0:00:31
Analyzing Monthly Wind Patterns with ERA5 Copernicus Data using Python
 0:19:39
How to download EAR5 data. Daliy Temperature
 0:12:41
How to download Climate data for Climate Change Action (CCA)
 0:13:54
Download Historical and Future Climate Data (Temperature, Precipitation etc.)
 0:03:37
C3S User Learning Services - Downloading data with the API
 0:04:45
Introducing the Copernicus Climate Change Services
 0:02:03
Introduction to the Climate Data Store and Toolbox - Requests
 0:03:07
How to download Copernicus Marine Products?
 0:00:29
Analyzing Monthly Averaged 2m Temperature with ERA5 Copernicus Data using Python
 0:03:32
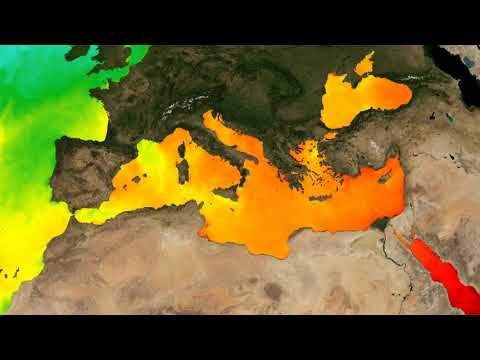
Digital Tour of Copernicus Marine Data
Комментарии