filmov
tv
AP Statistics | 2.1.1 | Describing Location in a Distribution

Показать описание
This video covers 2.1 (part 1 of 2) from The Practice of Statistics: Describing Location in a Distribution. In this video, we talk about how to describe where a data point lies in comparison to others in a distribution using ogive charts, percentiles, and standardized scores (z-scores). How to use percentiles, how to interpret a cumulative relative frequency graph (ogive), how to find the z-score of an observation, what is a z-score, how to interpret z-scores.
****
****
Tired of studying? Did you know I also teach dance? Come take a dance break with me!!!!
****
****
Tired of studying? Did you know I also teach dance? Come take a dance break with me!!!!
 0:14:04
AP Stats 2.1 - Percentiles & Z-Scores
 0:02:01
AP Statistics Summarized in UNDER 2 Minutes
 0:51:41
AP Statistics Unit 1 Full Summary Review Video
 0:05:03
Introduction to Type I and Type II errors | AP Statistics | Khan Academy
 0:13:15
AP Stat Exam Review Unit 1
 0:15:01
AP Statistics | Chapter 2 Review | Modeling Distributions of Data
 0:23:34
AP Statistics Unit 1
 0:07:18
Introduction to sampling distributions | Sampling distributions | AP Statistics | Khan Academy
 0:00:05
Statistics Formulas -1
 0:16:53
FRQs Unit 1 AP Stat
 0:14:23
AP Statistics | 2.1.1 | Describing Location in a Distribution
 0:07:18
Example: Comparing distributions | AP Statistics | Khan Academy
 0:13:57
2 | FRQ (Part A: Probability) | Practice Sessions | AP Statistics
 0:17:53
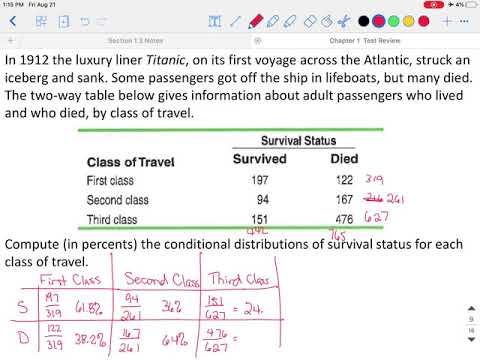
AP Stats Chapter 1 Test Review
 0:03:37
Calculating percentile | Modeling data distributions | AP Statistics | Khan Academy
 0:05:44
Examples identifying Type I and Type II errors | AP Statistics | Khan Academy
 0:04:49
Introduction to residuals and least-squares regression | AP Statistics | Khan Academy
 0:10:55
Z-Scores and Percentiles: Crash Course Statistics #18
 0:20:15
Unit 2 AP Stats Review for AP Test
 0:11:45
AP Statistics 10-Minute Recap
 0:44:58
AP Statistics - Exam Review #1 - Multiple Choice
 0:16:17
Unit 1 Key Concepts (AP Review)
 0:13:34
AP Statistics Unit 2
 0:16:18
1 | MCQ | Practice Sessions | AP Statistics
Комментарии