filmov
tv
How I Use 50+ Indicators on TradingView FREE Plan 2025

Показать описание
How I Use 50+ Indicators on TradingView FREE Plan 2025
Are you frustrated by TradingView’s restriction of just two indicators on its free plan? Do you dream of analyzing charts with all your favorite tools—Moving Averages, RSI, MACD, Bollinger Bands, and more—without shelling out for a premium subscription? If so, you’re in the right place! In this video, I’m revealing a game-changing tricks that lets you use unlimited indicators on TradingView for free. How? By combining multiple indicators into a single custom Pine Script using the power of AI. Whether you’re a beginner trader or a seasoned pro, this method will transform your technical analysis and give you an edge—all without spending a dime. Stick around, because I’m breaking it all down step by step. Ready to supercharge your charts? Let’s get started!
TradingView is one of the most popular charting platforms out there, loved for its clean interface and powerful tools. But for free plan users, the two-indicator limit can feel like a straitjacket. Technical analysis thrives on combining indicators to spot trends, confirm signals, and make informed decisions. With this hack, you’ll bypass that limitation and unlock a world of possibilities. Imagine plotting a 50-day Moving Average, RSI, and MACD all at once—on the free plan! This isn’t just a workaround; it’s a revolution for budget-conscious traders. Plus, it’s easy to implement with the right tools: Pine Script and AI. Let’s explore how it works.
Before we jump into the method, let’s talk about Pine Script, TradingView’s proprietary coding language. Think of it as your ticket to limitless customization. Pine Script lets you create custom indicators, strategies, and tools tailored to your trading style. It’s beginner-friendly yet powerful enough for advanced users. For this hack, Pine Script is essential because it allows us to bundle multiple indicator codes into one script that TradingView recognizes as a single indicator. Don’t worry if you’ve never coded before—I’ll show you how AI makes it effortless. Here’s a quick taste of what Pine Script can do:
Plot a Moving Average: plot(sma(close, 50))
Calculate RSI: rsi(close, 14)
Combine them: One script, multiple outputs.
Now, meet your secret teacher: AI. Platforms like ChatGPT have transformed how we approach coding. They can read, understand, and manipulate Pine Script codes with ease. Why is this a big deal? Because manually combining indicator codes can be time-consuming and error-prone, especially if you’re not a coding wizard. With AI, you simply feed it the codes for your desired indicators—say, a Moving Average and RSI—and ask it to merge them into one script. The AI does the heavy lifting, spitting out a unified Pine Script you can plug straight into TradingView. No coding skills? No problem. I’ll guide you through it.
Here’s the meat of the video: a detailed, foolproof guide to combining unlimited indicators. Follow these steps, and you’ll be charting like a pro in no time.
Step 1: Pick Your Indicators
Start by choosing the indicators you want to combine. These should align with your trading strategy. Here are some popular options:
Moving Averages (MA): Smooth out price data to spot trends.
Relative Strength Index (RSI): Measure momentum and overbought/oversold conditions.
MACD: Track trend direction and strength.
Bollinger Bands: Gauge volatility and potential breakouts.
For this example, let’s combine a 50-day MA and RSI. Tip: Start with 2–3 indicators to keep things manageable as you learn the process.
Step 2: Get the Pine Script Codes
Next, you need the Pine Script code for each indicator. Here’s how to find them:
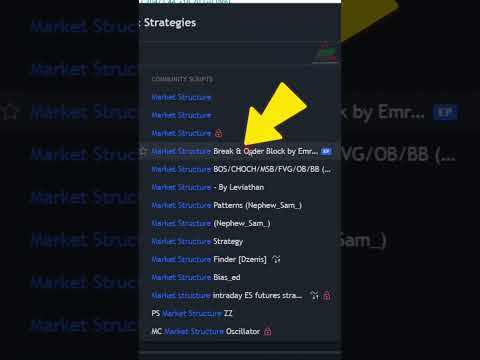
Built-in Indicators: TradingView’s Pine Script documentation (available on their website) lists codes for common indicators. Alternatively, search online forums or GitHub for shared scripts.
Custom Indicators: If you’ve created or downloaded a custom indicator, open its Pine Script in TradingView’s Pine Editor.
Click Here For More Videos :-
Teach Lane Official Social Media
*Disclaimer: This video is for educational purposes only. The information provided is not financial advice. Always do your own research and consult with a professional before making any trading decisions. Past performance does not guarantee future results. Trading in financial markets involves risk, and you could lose more than your initial investment. We do not endorse or recommend any specific strategy or product mentioned in this video.
The author, Dipak Das, is certified by SEBI NiSM and NSE F&O, but is not a SEBI registered investment advisor. The views expressed in this video are personal opinions and do not represent the views of any other entity.
#TradingviewIndicators #TradingviewFree
Are you frustrated by TradingView’s restriction of just two indicators on its free plan? Do you dream of analyzing charts with all your favorite tools—Moving Averages, RSI, MACD, Bollinger Bands, and more—without shelling out for a premium subscription? If so, you’re in the right place! In this video, I’m revealing a game-changing tricks that lets you use unlimited indicators on TradingView for free. How? By combining multiple indicators into a single custom Pine Script using the power of AI. Whether you’re a beginner trader or a seasoned pro, this method will transform your technical analysis and give you an edge—all without spending a dime. Stick around, because I’m breaking it all down step by step. Ready to supercharge your charts? Let’s get started!
TradingView is one of the most popular charting platforms out there, loved for its clean interface and powerful tools. But for free plan users, the two-indicator limit can feel like a straitjacket. Technical analysis thrives on combining indicators to spot trends, confirm signals, and make informed decisions. With this hack, you’ll bypass that limitation and unlock a world of possibilities. Imagine plotting a 50-day Moving Average, RSI, and MACD all at once—on the free plan! This isn’t just a workaround; it’s a revolution for budget-conscious traders. Plus, it’s easy to implement with the right tools: Pine Script and AI. Let’s explore how it works.
Before we jump into the method, let’s talk about Pine Script, TradingView’s proprietary coding language. Think of it as your ticket to limitless customization. Pine Script lets you create custom indicators, strategies, and tools tailored to your trading style. It’s beginner-friendly yet powerful enough for advanced users. For this hack, Pine Script is essential because it allows us to bundle multiple indicator codes into one script that TradingView recognizes as a single indicator. Don’t worry if you’ve never coded before—I’ll show you how AI makes it effortless. Here’s a quick taste of what Pine Script can do:
Plot a Moving Average: plot(sma(close, 50))
Calculate RSI: rsi(close, 14)
Combine them: One script, multiple outputs.
Now, meet your secret teacher: AI. Platforms like ChatGPT have transformed how we approach coding. They can read, understand, and manipulate Pine Script codes with ease. Why is this a big deal? Because manually combining indicator codes can be time-consuming and error-prone, especially if you’re not a coding wizard. With AI, you simply feed it the codes for your desired indicators—say, a Moving Average and RSI—and ask it to merge them into one script. The AI does the heavy lifting, spitting out a unified Pine Script you can plug straight into TradingView. No coding skills? No problem. I’ll guide you through it.
Here’s the meat of the video: a detailed, foolproof guide to combining unlimited indicators. Follow these steps, and you’ll be charting like a pro in no time.
Step 1: Pick Your Indicators
Start by choosing the indicators you want to combine. These should align with your trading strategy. Here are some popular options:
Moving Averages (MA): Smooth out price data to spot trends.
Relative Strength Index (RSI): Measure momentum and overbought/oversold conditions.
MACD: Track trend direction and strength.
Bollinger Bands: Gauge volatility and potential breakouts.
For this example, let’s combine a 50-day MA and RSI. Tip: Start with 2–3 indicators to keep things manageable as you learn the process.
Step 2: Get the Pine Script Codes
Next, you need the Pine Script code for each indicator. Here’s how to find them:
Built-in Indicators: TradingView’s Pine Script documentation (available on their website) lists codes for common indicators. Alternatively, search online forums or GitHub for shared scripts.
Custom Indicators: If you’ve created or downloaded a custom indicator, open its Pine Script in TradingView’s Pine Editor.
Click Here For More Videos :-
Teach Lane Official Social Media
*Disclaimer: This video is for educational purposes only. The information provided is not financial advice. Always do your own research and consult with a professional before making any trading decisions. Past performance does not guarantee future results. Trading in financial markets involves risk, and you could lose more than your initial investment. We do not endorse or recommend any specific strategy or product mentioned in this video.
The author, Dipak Das, is certified by SEBI NiSM and NSE F&O, but is not a SEBI registered investment advisor. The views expressed in this video are personal opinions and do not represent the views of any other entity.
#TradingviewIndicators #TradingviewFree
 0:05:25
How I Use 50+ Indicators on TradingView FREE Plan 2025
 0:08:20
40 INDICATORS IN ONE! Most Powerful BUY SELL Indicator on TradingView
 0:04:16
The Only TradingView INDICATOR You EVER Need [Secret Strategy]🔥
 0:18:53
Moving Average (EMA) Indicator In Nepse | Tutorial Video | Nepal Share Market | CA Supriya Sharma
 0:10:41
5 NEW TradingView Indicators That Are 100% Accurate
 0:04:38
How to Turn Any TradingView Indicator into a Profitable Strategy with ChatGPT! (Step-by-Step Guide)
 0:00:54
Insider Secrets: Wall Street's Best Trading Indicators | Einstein of Wall Street
 0:00:25
This indicator will help you predict market moves in Tradingview #shorts #forex #forextrading
 0:11:34
Pre-Earnings Indicator for ThinkOrSwim (Updated 2025)
 0:10:37
Best Indicator for Intraday Trading in Trading View!
 0:00:47
50 EMA Trading Strategy | Swing Trading Strategy | Moving averages strategy | Moving average Trading
 0:12:01
How to Use the Big Candle ICT Indicator (Full Guide)
 0:00:55
3 Most Effective Indicators on TradingView
 0:06:59
UT BOT ALERT Indicator Make CRAZY PROFITS, Here's How (2 Indicator FULL STRATEGY)
 0:03:56
RSI Indicator Trading Strategy (Advanced)
 0:00:46
Crazy RSI Indicator Tricks
 0:11:14
STOP Using the Heiken Ashi! This Indicator will DOUBLE your profits
 0:02:25
How To Add Indicators In TradingView 📊||📈 20 EMA, 50 EMA, STOCHASTIC | Candlestick Indicator
 0:00:54
I Found An AMAZING Trend Following Strategy #shorts
 0:00:36
Identify Market Trend with this Super INDICATOR #shorts #trader #trader #trader #tradingview #viral
 0:00:20
ONLY Trading Indicator You Need | Volume Profile 💸
 0:00:30
The only trading indicator I use 📈 #stocks #crypto #forex #tradingview
 0:00:48
Liquidity Swings indicator How to use?
 0:00:44
Use this Indicator to Identify Supply and Demand in Trading.
Комментарии