filmov
tv
Linear Correlation - 37 Rank Correlation Repeating values

Показать описание
#Statistics
#Correlation
#Rank Correlation
Prof. Charles Edward Spearman has given a method of finding coefficient of correlation between two variables. In this method, instead of values, the ranks are used to find out coefficient of correlation and hence the method is known as the method of rank correlation.
We know that qualitative phenomena cannot be numerically expressed, but it is convenient to assign them ranks.
Method of rank correlation can be used for finding out the relationship between qualitative phenomena like honesty, intelligence, beauty, poverty, etc. This method is also useful when the variations in the series are more. Pearson’s method becomes tedious in such situations.
Method of Calculation
According to this method the ranks are give separately to the values of each series. In each series, the highest value is given 1st rank. The next value is given the 2nd rank and so on. If two or more values are equal then tie arises. In such a case all such values are given ranks equal to the average value of their ranks.
After assigning ranks in the two series the differences in the corresponding ranks at the two series are obtained for all the pairs. These differences are denoted by ‘d’ and the value of d2 is obtained. The coefficient of rank correlation is then calculated by the following formula:
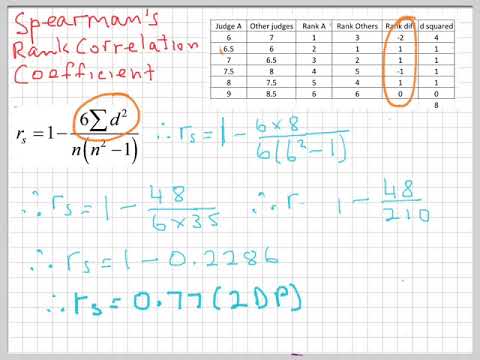
Rho = r = 1 - {6d^2 / n [(n^2)-1]}
Where, n = number of pairs
Remarks:
i. The value of coefficient of rank correlation between –1 and +1.
ii. If the ranks are same for each pair of the two series, then each value of d is 0. Hence, d2 = 0 and the value of r = +1 which shows perfect positive linear correlation between two variables.
iii. If the ranks are exactly in reverse order for each pair of two series, the value of r = d which shows perfect negative linear correlation between the two variables.
Merits
i. This method is easier to understand and apply in compared to Karl Pearson’s Method.
ii. When the data are of qualitative nature like honesty, beauty, etc. this method is convenient.
iii. When the dispersion in a series is high, this method is useful.
Limitations
i. This method does not give accurate result as compared to Pearson’s method.
ii. When there is large number of observations it is tedious to assign ranks.
iii. As the original values are not used in this method, only approximate value of coefficient of correlation is obtained.
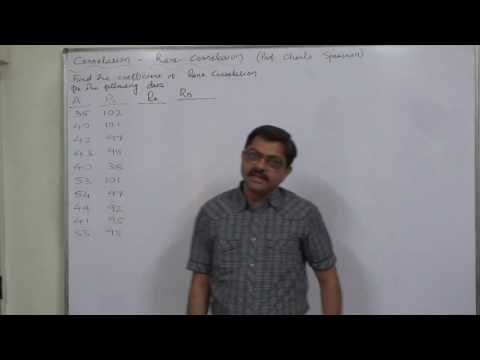
Case - When two or more values are equal in a series
Find Spearman’s coefficient of correlation:
X 35 40 42 43 40 53 54 49 41 55
Y 102 101 97 98 38 101 97 92 95 95
Correlation, Rank Correlation, Statistics, MBA, MCA, BE, CA, CS, CWA, CMA, CPA, CFA, BBA, BCom, MCom, BTech, MTech, CAIIB, FIII, Graduation, Post Graduation, BSc, MSc, BA, MA, Diploma, Production, Finance, Management, Commerce, Engineering , Grade-11, Grade- 12
#Correlation
#Rank Correlation
Prof. Charles Edward Spearman has given a method of finding coefficient of correlation between two variables. In this method, instead of values, the ranks are used to find out coefficient of correlation and hence the method is known as the method of rank correlation.
We know that qualitative phenomena cannot be numerically expressed, but it is convenient to assign them ranks.
Method of rank correlation can be used for finding out the relationship between qualitative phenomena like honesty, intelligence, beauty, poverty, etc. This method is also useful when the variations in the series are more. Pearson’s method becomes tedious in such situations.
Method of Calculation
According to this method the ranks are give separately to the values of each series. In each series, the highest value is given 1st rank. The next value is given the 2nd rank and so on. If two or more values are equal then tie arises. In such a case all such values are given ranks equal to the average value of their ranks.
After assigning ranks in the two series the differences in the corresponding ranks at the two series are obtained for all the pairs. These differences are denoted by ‘d’ and the value of d2 is obtained. The coefficient of rank correlation is then calculated by the following formula:
Rho = r = 1 - {6d^2 / n [(n^2)-1]}
Where, n = number of pairs
Remarks:
i. The value of coefficient of rank correlation between –1 and +1.
ii. If the ranks are same for each pair of the two series, then each value of d is 0. Hence, d2 = 0 and the value of r = +1 which shows perfect positive linear correlation between two variables.
iii. If the ranks are exactly in reverse order for each pair of two series, the value of r = d which shows perfect negative linear correlation between the two variables.
Merits
i. This method is easier to understand and apply in compared to Karl Pearson’s Method.
ii. When the data are of qualitative nature like honesty, beauty, etc. this method is convenient.
iii. When the dispersion in a series is high, this method is useful.
Limitations
i. This method does not give accurate result as compared to Pearson’s method.
ii. When there is large number of observations it is tedious to assign ranks.
iii. As the original values are not used in this method, only approximate value of coefficient of correlation is obtained.
Case - When two or more values are equal in a series
Find Spearman’s coefficient of correlation:
X 35 40 42 43 40 53 54 49 41 55
Y 102 101 97 98 38 101 97 92 95 95
Correlation, Rank Correlation, Statistics, MBA, MCA, BE, CA, CS, CWA, CMA, CPA, CFA, BBA, BCom, MCom, BTech, MTech, CAIIB, FIII, Graduation, Post Graduation, BSc, MSc, BA, MA, Diploma, Production, Finance, Management, Commerce, Engineering , Grade-11, Grade- 12
 0:05:52
Linear Correlation - 37 Rank Correlation Repeating values
 0:10:03
Linear Correlation - 36 Rank Correlation Assigning Ranks
 0:05:05
Spearman's Rank Correlation Coefficient - Problem 1 - Engineering Mathematics 3
 0:00:45
#37. Select the Most Likely Value of the Linear Correlation Coefficient Based on the Scatterplot
 0:04:20
Linear Correlation - 38 Rank Correlation Reverse Calculation
 0:14:40
Lec37/Basic Statistics/Rank Correlation Coefficient
 0:07:25
Linear Correlation - 35 Rank Correlation Basics
 0:07:10
Linear Correlation - 39 Rank Correlation Reverse Calculation to find Sample Size
 0:09:26
How To... Calculate Pearson's Correlation Coefficient (r) by Hand
 0:25:09
Spearman's Rank Correlation Part 3 Linear Correlation Part 14
 0:25:13
Rank Correlation Coefficient || Spearman rank Correlation coefficient || Rank Correlation || Arya
 0:31:18
Spearman's Rank Correlation Part 1-2 Linear Correlation Part 12
 0:06:45
Spearman’s Rank Correlation Coefficient
 0:20:24
Chapter 18.3: How to Calculate Spearman’s Rank Correlation
 0:06:22
Finding the Regression Equation/Regression Line by Hand (Formula)
 0:33:08
Spearman's Rank Correlation Part 2 Linear Correlation Part 13
 0:09:43
Coefficient of correlation between x & y ||Karl Pearson Coefficient of Correlation.
 0:07:42
Correlation coefficient ~ Part 1
 0:20:20
Statistics - Rank Correlation
 0:05:59
Linear Correlation 16 Calculation of Coefficient of Correlation by the most simple formula
 0:03:27
Spearmans rank same values
 0:05:01
GCSE Statistics: Spearman's Rank Correlation Coefficient Example
 0:15:21
A-level biology STATISTICS HELP: The Correlation Coefficient, worked example of Spearman's Rank
 0:00:20
Bro’s hacking life 😭🤣
Комментарии