filmov
tv
Using System Activity Report (SAR) in Linux For Present & Past System Performance Monitoring

Показать описание
Using System Activity Report (SAR) in Linux For Present & Past System Performance Monitoring:
====
System Activity Report (sar) is a Unix System V-derived system monitor command used to report on various system loads, including CPU activity, memory/paging, interrupts, device load, network and swap space utilization. Sar uses /proc filesystem for gathering information.
# dnf repolist
# dnf install sysstat -y
# systemctl start sysstat
# systemctl enable sysstat
It collects the data every 10 minutes and generate its report daily. Below crontab file is responsible for collecting and generating reports.
# vim /etc/cron.d/sysstat
# Run the tool at every 10 minutes automatically.
*/10 * * * * root /usr/lib64/sa/sa1 1 1
# Generate a daily summary of process accounting at 23:55
55 23 * * * root /usr/lib64/sa/sa2 -A
Below is the Config File of SysStat ( sar command ).
# cat /etc/sysconfig/sysstat
Example:1 Generating CPU Report on the Fly 6 times at every 3 seconds.
# sar 3 6
If the %I/O wait is more than zero for a longer period of time then we can consider there is some bottleneck in I/O system (Hard disk or Network).
Example:2 Saving sar output to a file using -o
# sar 2 5 -o /tmp/data
use “sar -f filename” to display the reports.
# sar -f /tmp/data
Example:3 Generating Memory Usage report using -r option in the sar command which is used to generate memory usage report.
# sar -r 3 6
kbcommit & %commit is the overall memory used including RAM & Swap
Example:4 Generating Paging Statistics Report using -B
-B option in the sar command is used to display paging statistics.
# sar -B 3 6
In the report majflts/s shows the major faults per second means number of pages loaded into the memory from disk (swap), if its value is higher then we can say that system is running of RAM.
%vmeff indicates the number of pages scanned per second, if it’s vaule is 100 % its is consider OK and when it is below 30 % then there is some issue with virtual memory. Zero value indicates that there is no page scanned during that time.
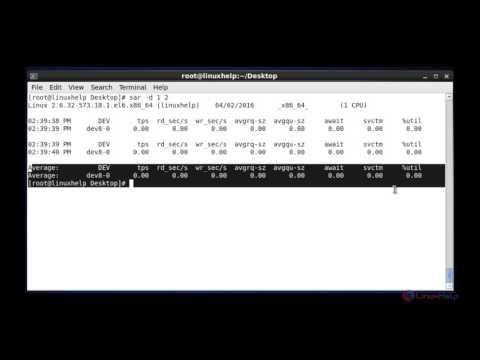
Example:5 Generating block device statistics report using -d
-d option in the sar command is used to display the block device statistics report. Using option -p (pretty-print) along with -d make the dev column more readable, example is shown below :
# sar -d -p 2 4
Example:6 Generating Network statistic report using -n
-n option in the sar command is used to generate network statistic report. Below is the synatx :
# sar -n {keyword} or {ALL}
To generate all network statistic report use below command :
# sar -n ALL
Example:7 Reading SAR log file using -f
As we have discuss that sar logs files are kept under /var/log/sa/saDD, using -f option in sar command we can read the log files.
# sar -r -f /var/log/sa/sa12
*****
Thanks for watching the video. If it helped you then, please do like & share it with others as well. Feel free to post your queries & suggestions, we will be glad to answer your queries.
If you like our hard work then do subscribe to our channel & turn on the bell notification for latest updates.
*****
Join this channel to get access to perks:
*****
******
Contact Us:
******
Follow Us On Social Media Platforms:
=======
©COPYRIGHT. ALL RIGHTS RESERVED.
====
System Activity Report (sar) is a Unix System V-derived system monitor command used to report on various system loads, including CPU activity, memory/paging, interrupts, device load, network and swap space utilization. Sar uses /proc filesystem for gathering information.
# dnf repolist
# dnf install sysstat -y
# systemctl start sysstat
# systemctl enable sysstat
It collects the data every 10 minutes and generate its report daily. Below crontab file is responsible for collecting and generating reports.
# vim /etc/cron.d/sysstat
# Run the tool at every 10 minutes automatically.
*/10 * * * * root /usr/lib64/sa/sa1 1 1
# Generate a daily summary of process accounting at 23:55
55 23 * * * root /usr/lib64/sa/sa2 -A
Below is the Config File of SysStat ( sar command ).
# cat /etc/sysconfig/sysstat
Example:1 Generating CPU Report on the Fly 6 times at every 3 seconds.
# sar 3 6
If the %I/O wait is more than zero for a longer period of time then we can consider there is some bottleneck in I/O system (Hard disk or Network).
Example:2 Saving sar output to a file using -o
# sar 2 5 -o /tmp/data
use “sar -f filename” to display the reports.
# sar -f /tmp/data
Example:3 Generating Memory Usage report using -r option in the sar command which is used to generate memory usage report.
# sar -r 3 6
kbcommit & %commit is the overall memory used including RAM & Swap
Example:4 Generating Paging Statistics Report using -B
-B option in the sar command is used to display paging statistics.
# sar -B 3 6
In the report majflts/s shows the major faults per second means number of pages loaded into the memory from disk (swap), if its value is higher then we can say that system is running of RAM.
%vmeff indicates the number of pages scanned per second, if it’s vaule is 100 % its is consider OK and when it is below 30 % then there is some issue with virtual memory. Zero value indicates that there is no page scanned during that time.
Example:5 Generating block device statistics report using -d
-d option in the sar command is used to display the block device statistics report. Using option -p (pretty-print) along with -d make the dev column more readable, example is shown below :
# sar -d -p 2 4
Example:6 Generating Network statistic report using -n
-n option in the sar command is used to generate network statistic report. Below is the synatx :
# sar -n {keyword} or {ALL}
To generate all network statistic report use below command :
# sar -n ALL
Example:7 Reading SAR log file using -f
As we have discuss that sar logs files are kept under /var/log/sa/saDD, using -f option in sar command we can read the log files.
# sar -r -f /var/log/sa/sa12
*****
Thanks for watching the video. If it helped you then, please do like & share it with others as well. Feel free to post your queries & suggestions, we will be glad to answer your queries.
If you like our hard work then do subscribe to our channel & turn on the bell notification for latest updates.
*****
Join this channel to get access to perks:
*****
******
Contact Us:
******
Follow Us On Social Media Platforms:
=======
©COPYRIGHT. ALL RIGHTS RESERVED.
 0:13:47
Using System Activity Report (SAR) in Linux For Present & Past System Performance Monitoring
 0:29:49
Linux Performance Analysis - System Activity Reporter (sar)
 0:00:51
How to see system activity report (SAR) | DailyStudyLinux #learnlinux #linuxinterviewquestions
 0:08:40
Linux Crash Course - The sar Command
 0:15:48
Graphical Reporting using System Activity Reports (SAR) & 'GNUPLOT' - Networknuts
 0:06:25
SAR command using Generate CPU, Memory and I/O report #part1
 0:09:24
How to Use Sar (System Activity Reporter) | Linux Essential Commands with Jay LaCroix
 0:00:47
How to know system activity(SAR) report for old time | DailyStudyLinux #learnlinux #linuxlearning
 0:38:18
11. UNIX/LINUX System recourse commands hands-on
 0:01:02
System Activity Reports With The Sar Commands Part2
 0:12:11
Monitoring Linux server with SAR command || sar command live usages and troubleshooting system.
 0:06:32
How to Monitor Linux system Performance Using Sar Tool
 0:09:17
What is a SAR | What is a Suspicious Activity Report | When to submit a SAR - KYC Lookup
 0:01:01
Linux System Activity Report ‘sar’ watch it at YouTube.com/@MyWebUniversity
 0:07:37
Linux CPU Memory Network Usage History | Linux Performance Metric History
 0:00:16
Lung inflation in Science Lesson #science #teacher #biology
 0:07:36
35 Creating System Activity Reports
 0:21:25
SAR command in Linux with examples (Tamil)
 0:04:49
System Activity Reports with the Sar Command
 0:00:28
Linux Commands: sar
 0:26:31
How to Monitor Linux system Performance Using Sar| Troubleshoot server performance issue with sar
 0:01:58
System Activity Reports With The Sar Commands
 0:09:17
My Guidance on SAR to Boost Your AML Knowledge in 9 Minutes
 0:03:41
Producing System Reports Using sar - LFCE Video Course by Sander van Vugt
Комментарии