filmov
tv
7. How to Plot Titles and Position them in Matplotlib | Python Matplotlib Tutorial | Amit Thinks

Показать описание
In this lesson, learn to plot titles and position them in Matplotlib. To set the titles in a graph, use the title() function in Matplotlib. Position the title using the loc parameter of the title().
#matplotlib #python #amitthinks
-------------------------------------------------------------------------------------------------------------
👉 Follow me
-------------------------------------------------------------------------------------------------------------
► Top Free Video Tutorials
► Programming - Free Study Material (Downloadable)
► Web Dev - Free Study Material (Downloadable)
► Database - Free Study Material (Downloadable)
► CMS - Free Study Material (Downloadable)
► Free Interview QA
👉 About Amit Thinks YouTube Channel
Join this channel to get access to perks:
► Subscribe
 0:09:36
9 Plot Frameworks in 10 Minutes | Rapid Writing
 0:16:05
#8 Applying Title and legends in a plot | Matplotlib tutorial 2021
 0:07:46
How to Plot Land Title using Autocad|Vlog #16
 0:08:08
How to Set The Title To The Plot | Matplotlib | Python Tutorials
 0:10:20
7 WORST Types of Plot Holes (Writing Advice)
 0:01:57
Plot Multiple Lines in Excel
 0:02:55
CHARACTER, SETTING & PLOT 🤔| Learn parts of a story in 2 minutes
 0:05:54
APA 7th Edition: Set up an APA Format Paper in 6 Minutes | Scribbr 🎓
 0:00:12
Tips For Writing Great Plot Twists
 0:23:19
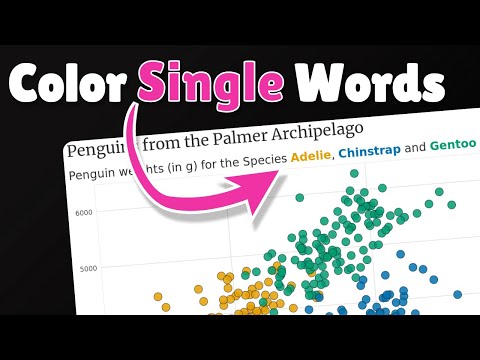
Plot Titles with Multiple Colors in Matplotlib (Python)
 0:04:09
Data & Text Labels on Scatter Plot
 0:12:48
Pirates of The Caribbean 7,8,9 Title and Plot Ideas THEORY
 0:07:08
Plot Titles And Axis Labels In Base R and GGPLOT2
 0:05:20
Rotate ylab & xlab Axis Title in Base R Plot (3 Examples) | Horizontal & Vertical | Change M...
 0:02:26
Plotly Scatter Plot Basics: data, x, y, title, template, color, size, hover data
 0:04:48
Change Position of ggplot2 Plot Title (Examples) | Adjust & Move to Center, Right-Aligned & ...
 0:05:09
How to Insert Figure Captions and Table Titles in Microsoft Word
 0:00:24
🥵 unexpected plot twist 🔥 | hierarchy kdrama ending scene #hierarchy #newkdrama2024 #ongoingkdrama...
 0:00:20
The glory plot twist we never expected 😂 #kdrama
 0:03:34
Remove your plot legend and colorize your title instead
 0:21:04
Formating of Matlab Plot Using Commands
 0:10:27
PLOTTING GRAPH -MATLAB Version used 2018a || COMMANDS- Plot,xlabel,title,legend,grid on & axis
 0:05:50
axis tick positions and tick labels of a python Matplotlib plot
 0:02:14
Story Elements Part 1: Characters, Setting, and Events | English For Kids | Mind Blooming
Комментарии