filmov
tv
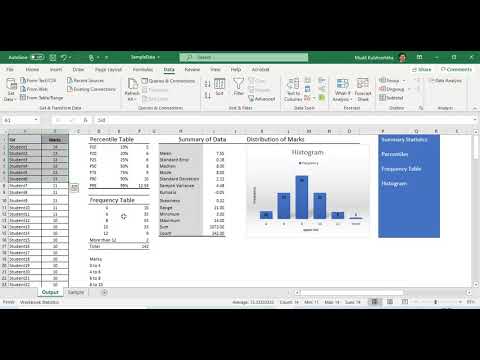
Descriptive Statistics In Excel: Detailed Explanation With Example

Показать описание
Descriptive Statistics Excel - detailed explanation with examples, Descriptive Statistics In Excel with Graphical Results
Hello Friends,
Descriptive Statistics is a primary tool used to provide information about the central tendency and variability of your data. I have explained it in detail with the help of practical examples and graphical analysis.
This video consists of the following topics:
✅ Introduction to Descriptive Statistics (Data Analysis In Excel)
✅ Population and Sample
✅ Population parameters and Sample parameters
✅ Measures of Central Tendency
✅ Measures of Variation (Measures of Dispersion)
✅ What is Descriptive Statistics?
✅ Example to perform Descriptive Statistics
✅ Detailed procedure to perform Descriptive Statistics in Excel
✅ Interpretation of results from Descriptive Statistics
✅ Descriptive Statistics by variable in Microsoft Excel
✅ Interpretation of results from Descriptive Statistics by variable
✅ Descriptive Statistics with Graphical Analysis
✅ Learn Lean Six Sigma and Minitab Most Effectively and Practically
I am sure you will like it.
The Important links about LEARN & APPLY:
0:00 Introduction to Descriptive Statistics (Data Analysis In Excel)
0:36 Population and Sample
1:39 Population parameters and Sample parameters
2:20 Measures of Central Tendency
3:00 Measures of Variation (Measures of Dispersion)
3:56 What is Descriptive Statistics?
4:21 Example to perform Descriptive Statistics
5:19 Detailed procedure to perform Descriptive Statistics in Excel
6:26 Interpretation of results from Descriptive Statistics
7:21 Descriptive Statistics by variable in Microsoft Excel
8:21 Interpretation of results from Descriptive Statistics by variable
9:12 Descriptive Statistics with Graphical Analysis
11:16 Learn Lean Six Sigma and Minitab Most Effectively and Practically
Thank you for watching...🙏😊
#descriptivestatistics #descriptivestatisticsexcel #exceldataanalysis #dataanalysisexcel #sixsigmaexcel #analysistools #leansixsigma #sixsigma #successfulcareerhub #learnandapply #statistics #excel
 0:08:10
How To Perform Descriptive Statistics In Excel (Very Easy!)
 0:01:00
Descriptive Statistics in Excel Mean, Median, Mode, Std. Deviation,...
 0:14:59
Statistics in Excel Tutorial 1.1. Descriptive Statistics using Microsoft Excel
 0:05:36
Descriptive Statistics in Excel Using the Data Analysis Tool
 0:14:25
Descriptive statistics and data visualisation. An introduction to statistics and working with data
 0:03:25
Descriptive Statistics in Excel
 0:08:01
Descriptive Statistics Explained in Excel: Understanding Descriptive Statistics
 0:49:16
Beginner to Pro FREE Excel Data Analysis Course
 7:51:19
R course full tutorials 6 hours part 75
 0:04:24
Descriptive Statistics in Excel with Data Analysis Toolpak
 0:00:38
How I use Excel as a Data Analyst 📊🤓
 0:08:45
Descriptive statistics using Microsoft excel
 0:01:54
How to get descriptive statistics in Excel
 0:05:52
Calculate Mean Median Mode and Standard Deviation in Excel
 0:23:56
Exploratory Data Analysis With Excel - Part 1 - Basic Numerics
 0:06:27
Excel - Basic Descriptive Statistics (Mean, Variance, Standard Devation, etc.)
 0:12:34
Calculating Descriptive Statistics Using Excel
 0:02:58
Use Excel 2016 to find summary statistics for quantitative data
 0:21:04
Cleaning Data in Excel | Excel Tutorials for Beginners
 0:00:23
Find Mean, Median and Mode in Excel
 4:11:47
Excel Data Analytics Full Course | Essential Skills For Data Analysis In Excel | Simplilearn
 0:03:42
How To... Display a Range of Descriptive Statistics in Excel 2010
 0:14:48
Introduction to Pivot Tables, Charts, and Dashboards in Excel (Part 1)
 0:28:14
Quantitative Data Analysis 101 Tutorial: Descriptive vs Inferential Statistics (With Examples)
Комментарии