filmov
tv
MAY 2024 POWER BI UPDATE // Preview PBI files in SharePoint, Copilot Updates AND MORE

Показать описание
In this video were going to look at some of the new features from the May 2024 update.
🕓 TIMESTAMPS
0:00 - Intro
00:41 - Modern Tooltips
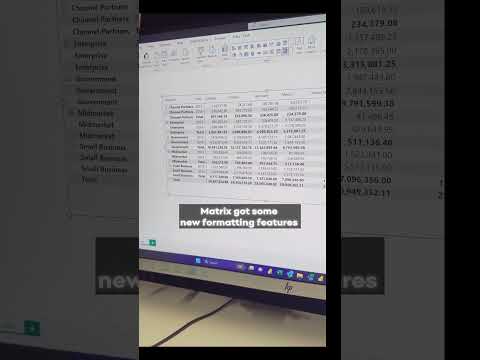
01:24 - New Matrix Layout
02:07 - On object interaction updates
02:35 - Pane manager
02:55 - Publish to folders
03:38 - Ask questions to Copilot
04:12 - DAX Query view
05:52 - Manage relationships
06:29 - Model explorer
07:01 - Preview files on SP or OD
08:00 - Direct Lake Git support
-
📣 Get Demo Files HERE
🔍 Looking to get started in data? Check out this COURSE to get the essential skills you need. No experience required.
📰 Sign up to our FREE Weekly Newsletter for Power BI news, community updates and more
🛒 Power BI TEMPLATES and more at our digital shop
❤ Other ways to SUPPORT us
📧 GET IN TOUCH
🤝 SOLUTIONS ABROAD
Hi Power BI fans, my name is Fernan. In 2018 I founded Solutions Abroad to help fellow data enthusiasts learn Microsoft’s tool, Power BI. I’m currently based in London with over 8 years of experience working with data and business intelligence. In this channel I provide educational videos about Power BI including tips and tricks, step by step tutorials, news, and all of it for FREE. I also provide some paid content such as courses, templates as well as consultancy services.
If you like what we’re doing here and would like to support, consider purchasing something or donating through our Patreon, every little penny helps us keep the channel going.
🙏 THANK YOU
Thank you so much for checking out my channel and my videos. You, the community, have been instrumental in growing the channel to where it is now. Hope to see you again on my next video!
#PowerBI #DataAnalytics #BusinessIntelligence
 0:12:16
Power BI Update - May 2024
 0:05:30
Check out the new features for Power BI update May 2024 !
 0:23:21
Power BI May 2024 Update: 10 Fresh New Features!!!
 0:08:53
MAY 2024 POWER BI UPDATE // Preview PBI files in SharePoint, Copilot Updates AND MORE
 0:16:29
Power BI Update - March 2024
 0:07:57
Power BI Update May 2024 - Catch Up with Nags
 0:06:47
NEW Updates to the Matrix Visual in Power BI | May 2024 Update
 0:04:55
MAY 2024 Power BI Update | Master Publish to Folders and Matrix Layout
 0:02:21
This Course may get you a Promotion | Power BI & Data Visualization | Grad Me Up!!
 0:00:17
MATRIX in Power BI got an UPGRADE 🚀 | May 2024 Update
 0:03:44
Power BI Matrix Visual new features - May 2024 Update
 0:20:42
Power BI Update - July 2024
 0:11:07
Power BI May 2024 Update: New Matrix Layouts, Line Enhancements & Manage Relationships | MiTutor...
 0:03:46
Power BI Line chart new features - May 2024 update
 0:12:21
Power BI Update - June 2024
 0:10:02
The Stunning New Features of Power BI - April 2024 Update!
 0:50:24
Power BI New Hot Features | May 2024 update | Power BI Tutorial 2024 | Power BI Updates
 0:30:06
Cashflow / P&L Statement in Power BI - (May 2024 Update)
 0:09:05
I Tried Every Power BI Model View Update
 0:03:09
BEST NEWS ever for Power BI business users!! There is a BUT though....
 0:00:50
Power BI May 2024 Updates: Top 3 Features You Need to Know! #powerbi #powerbiforbeginners #shorts
 0:01:06
Power BI May 2024 Update: Top 3 Game-Changing Features! #powerbi #powerbi_training #powerbipro
 0:01:19
Power BI May 2024 Update
 0:19:59
Fabric Monthly Update - April 2024
Комментарии