filmov
tv
Time Series Analysis and Forecasting - Forecasting Sales in Python - ARIMA, AR, MA models theory

Показать описание
Time Series Analysis and Forecasting in Python | Forecasting Sales
In this time series analysis and forecasting video tutorial I have talked about how you can forecast sales data in python. We’ll see the relevant libraries like pandas, matlotlib, stattools used in this project tutorial for data science and finally how we can compare naïve time series model, ARIMA model and hyperparamter tuned model to determine which model is working fine.
Also I have talked about various interview questions and tips and tricks related to time series theory and python code which can be asked in an interview or in a normal business scenario.
Other data science project –
Tableau Data Science Project 2 - Tableau Project for Practice Data Analysis and Prediction
Python Complete Tutorial for Beginners [Full Course] 2019
Python Complete Tutorial for Beginners [Full Course] 2019 - Part 2
Python Text Analytics for Beginners - Part 1 - Creating and Manipulating Strings in Python
Connect with me on
⭐My Favorite Python Books
Thank you
Abhishek Agarrwal
 0:07:29
What is Time Series Analysis?
 0:03:00
Introducing Time Series Analysis and forecasting
 0:03:15
Time Series Forecasting in Minutes | Time Series Analysis Overview
 0:08:46
Time Series Analysis Overview | Basics of Time Series Forecasting| Understanding Time Series Data
 0:18:06
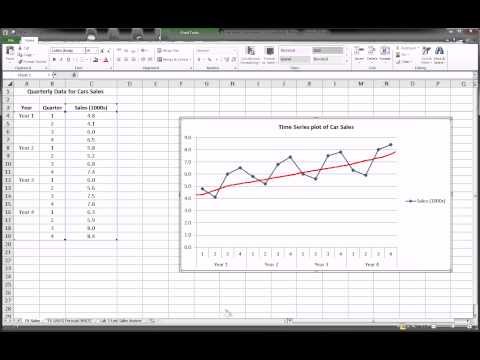
Excel - Time Series Forecasting - Part 1 of 3
 0:53:37
Time Series Analysis | Time Series Forecasting | Time Series Analysis In Excel | Simplilearn
 0:53:14
Time Series Forecasting Theory | AR, MA, ARMA, ARIMA | Data Science
 0:23:09
Time Series Forecasting with XGBoost - Use python and machine learning to predict energy consumption
 0:59:59
⏰ Crowd Forecast News Episode #446 (Norman Hallett, Anka Metcalf, The Option Professor)
 1:08:47
Time Series Analysis and Forecasting: An Overview for Beginner Data Scientists
 0:11:09
Time Series Vs Non Time Series Problems- Why Time Series Forecasting Is Difficult?
 4:46:22
Time Series Analysis | Time Series Forecasting | Time Series Analysis in R | Ph.D. (Stanford)
 0:38:20
Time Series Analysis in Python | Time Series Forecasting | Data Science with Python | Edureka
 0:26:05
TIME SERIES ANALYSIS THE BEST EXAMPLE
 0:48:00
KASNEB-CPA-Quantitative Analysis-Time series-SAMPLE PAPER 1
 0:08:05
Why Are Time Series Special? : Time Series Talk
 0:11:00
Moving Average Time Series Forecasting with Excel
 0:09:26
Time Series Talk : ARIMA Model
 0:13:52
Time Series Forecasting with Machine Learning
 0:04:52
Forecasting: Moving Averages, MAD, MSE, MAPE
 0:24:23
Forecasting Future Sales Using ARIMA and SARIMAX
 0:42:45
Kishan Manani - Feature Engineering for Time Series Forecasting | PyData London 2022
 0:14:20
Two Effective Algorithms for Time Series Forecasting
 1:16:19
8. Time Series Analysis I
Комментарии