filmov
tv
How To Interpret A Synoptic Weather Map Like A Pro!

Показать описание
okayyyy, THANKS for watching and Yesss if you've watched until the END. You've got yourself a distinctionNNNN!!!! AsiyEe subscribe..
CLIMATOLOGY "We Learn We Share" Geography!!
We Learn We Share,Interpreting a synoptic weather map involves analyzing the various symbols and lines that represent different weather conditions and patterns in a given region. Here are some key elements to look for when interpreting a synoptic weather map:
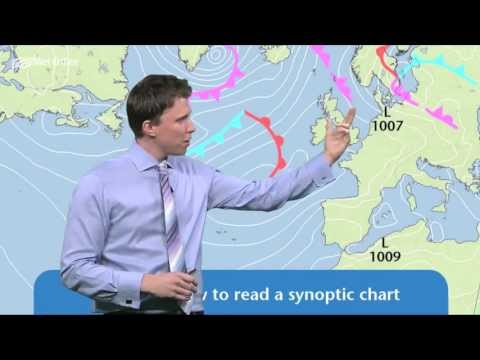
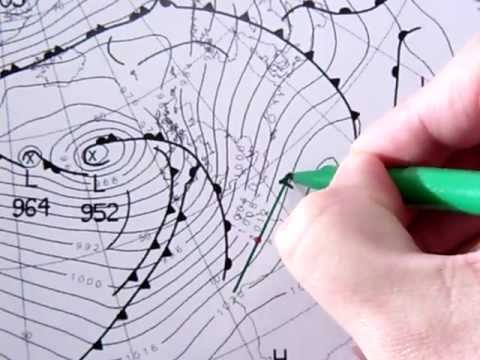
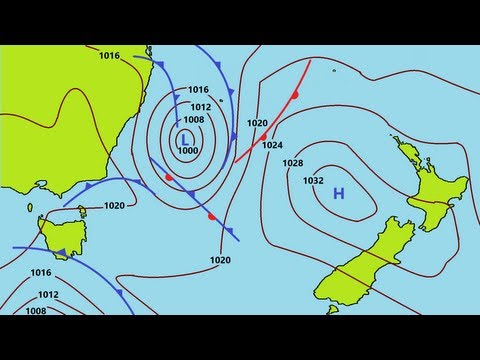
1. Pressure systems: These are represented by high and low-pressure centers. High-pressure systems are typically associated with fair, dry weather while low-pressure systems are associated with stormy, wet weather.
2. Fronts: Fronts are the boundaries between different masses of air and are typically indicated by lines with triangles or semicircles. A cold front, for example, is represented by a solid blue line with triangles pointing in the direction of movement, indicating a boundary between colder, denser air and warmer, less dense air. A warm front, on the other hand, is represented by a solid red line with semicircles pointing in the direction of movement, indicating a boundary between warmer, less dense air and colder, denser air.
3. Isobars: Isobars are lines that connect points of equal pressure. These lines can help identify areas of high and low pressure and indicate the strength and direction of wind flow.
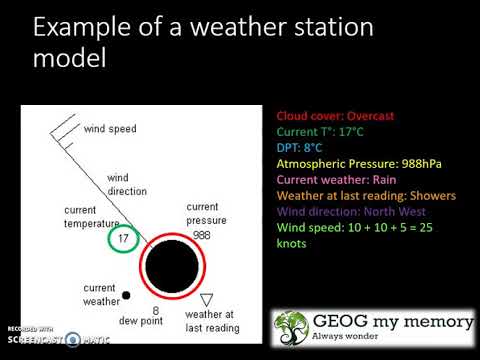
4. Weather symbols: Symbols on the map represent different types of weather conditions, such as rain, snow, fog, and thunderstorms. These symbols are typically accompanied by a letter or number indicating the intensity or likelihood of the weather event.
5. Temperature: Temperature can be indicated on the map using various colors or shading techniques. This can help identify areas of warm and cold air and indicate the location of temperature gradients.
By analyzing these elements and considering their interactions, you can gain insight into the current and future weather patterns in a given region. #closeupeducation #geography #southafrica #weather
CLIMATOLOGY "We Learn We Share" Geography!!
We Learn We Share,Interpreting a synoptic weather map involves analyzing the various symbols and lines that represent different weather conditions and patterns in a given region. Here are some key elements to look for when interpreting a synoptic weather map:
1. Pressure systems: These are represented by high and low-pressure centers. High-pressure systems are typically associated with fair, dry weather while low-pressure systems are associated with stormy, wet weather.
2. Fronts: Fronts are the boundaries between different masses of air and are typically indicated by lines with triangles or semicircles. A cold front, for example, is represented by a solid blue line with triangles pointing in the direction of movement, indicating a boundary between colder, denser air and warmer, less dense air. A warm front, on the other hand, is represented by a solid red line with semicircles pointing in the direction of movement, indicating a boundary between warmer, less dense air and colder, denser air.
3. Isobars: Isobars are lines that connect points of equal pressure. These lines can help identify areas of high and low pressure and indicate the strength and direction of wind flow.
4. Weather symbols: Symbols on the map represent different types of weather conditions, such as rain, snow, fog, and thunderstorms. These symbols are typically accompanied by a letter or number indicating the intensity or likelihood of the weather event.
5. Temperature: Temperature can be indicated on the map using various colors or shading techniques. This can help identify areas of warm and cold air and indicate the location of temperature gradients.
By analyzing these elements and considering their interactions, you can gain insight into the current and future weather patterns in a given region. #closeupeducation #geography #southafrica #weather
 0:08:38
How To Interpret A Synoptic Weather Map Like A Pro!
 0:04:10
How to read a synoptic chart
 0:04:25
Understanding synoptic charts
 0:02:35
How to read a synoptic weather chart
 0:03:21
Synoptic chart wind interpretation
 0:05:16
How to Read Weather Maps
 0:30:34
Geography Climatology: Reading and interpreting Synoptic Weather Maps| weather interpretation|
 0:29:28
Interpreting Synoptic Charts
 0:09:57
How to read a synoptic chart - Part one
 0:08:31
Geography: Synoptic weather maps exam tips questions review
 0:01:56
How to Read a Weather Map
 0:02:07
Wind speed from a synoptic chart
 0:02:24
Grade 10-12 Geography: Synoptic weather maps
 0:04:10
How to Read a Synoptic Chart | RYA | Solent Boat Training
 0:03:21
Synoptic chart wind interpretation
 0:04:51
Weather modules Reading synoptic chart
 0:12:54
Synoptic Weather Map Interpreting | Grade 12 | Geography
 0:12:24
Synoptic charts / weather maps
 0:14:26
Grade 12 Geography - Synoptic weather maps
 0:18:27
Understanding Weather (Synoptic) Charts - Geography
 0:04:27
Weather: Determining Direction of Wind on Weather Map
 0:08:03
Reading Synoptic Charts
 0:08:04
How to Read a Synoptic Chart - Part 3
 0:07:47
Synoptic Charts
Комментарии