filmov
tv
How to Graph in MATLAB

Показать описание
This video shows the simple process of plotting one or more equations in MATLAB with all the labels and legends. Fast and easy way to get all you need with MATLAB. Below I have the code attached.
%% Simple guide to graph
clc; clear
x = -10:1:10; %parameters of the independent varianle x
y = x + 3; %parameters of the variable y
plot(x,y,'r'); %plot the variables listed in the equation
xlabel('X'); %insert what you want the x label to be called
ylabel ('Y'); %insert what you want the y label to be called
title ('X vs. Y') %insert what you want the title of the plot to be
legend ('Insert Function of first line'); %gives a legend where you can label each line on the graph
%% Simple guide to graph 2 or more equations
clc;clear;
x1 = -10:1:10; %parameters of the independent varianle x1
x2 = -10:1:10; %parameters of the independent varianle x2
x3 = -10:1:10;
y1 = x1 + 2; %equation one
y2 = x2 - 2; %equation two
y3 = 2*x3 + 1; %euqation three
hold on %we need hold on to plot both equations on one graph
plot(x1,y1,'r'); %plot the first equation with a red line
plot (x2,y2,'b'); %plot second equation with a blue line
plot (x3,y3, 'g'); %plot third equation with green line
xlabel('X'); %insert what you want the x label to be called
ylabel ('Y'); %insert what you want the y label to be called
title ('X vs. Y') %insert what you want the title of the plot to be
legend ('Insert Function of first line','Function or name of second line','insert function of 3rd line');
%gives a legend where you can label each line on the graph
hold off %ends hold on for the graph
%% Graph with plots vs equation
clc;clear;
x1 = -10:1:10; %parameters of the independent varianle x1
y1 = -3*x1+3; %equation one
hold on %hold because we are ploting two things on one plot
plot(x1,y1); %plot first equation
x2 = [-7 -4 -1 0 2 5 7]; %given plot data for x
y2 = [ 20 14 6 3 -2 -10 -15]; %given plot data for y
plot (x2,y2,'redo'); %plot the given data with red circles for the points
hold off %hold off
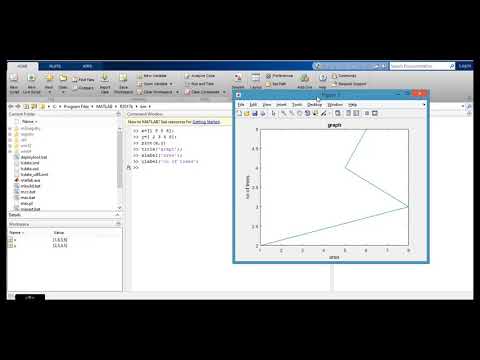
title('insert title of the plot') %title of the plot
xlabel('x') %x label
ylabel('y') %y label
legend('equation','Given data') %legend for equation one and the given data
%% Simple guide to graph
clc; clear
x = -10:1:10; %parameters of the independent varianle x
y = x + 3; %parameters of the variable y
plot(x,y,'r'); %plot the variables listed in the equation
xlabel('X'); %insert what you want the x label to be called
ylabel ('Y'); %insert what you want the y label to be called
title ('X vs. Y') %insert what you want the title of the plot to be
legend ('Insert Function of first line'); %gives a legend where you can label each line on the graph
%% Simple guide to graph 2 or more equations
clc;clear;
x1 = -10:1:10; %parameters of the independent varianle x1
x2 = -10:1:10; %parameters of the independent varianle x2
x3 = -10:1:10;
y1 = x1 + 2; %equation one
y2 = x2 - 2; %equation two
y3 = 2*x3 + 1; %euqation three
hold on %we need hold on to plot both equations on one graph
plot(x1,y1,'r'); %plot the first equation with a red line
plot (x2,y2,'b'); %plot second equation with a blue line
plot (x3,y3, 'g'); %plot third equation with green line
xlabel('X'); %insert what you want the x label to be called
ylabel ('Y'); %insert what you want the y label to be called
title ('X vs. Y') %insert what you want the title of the plot to be
legend ('Insert Function of first line','Function or name of second line','insert function of 3rd line');
%gives a legend where you can label each line on the graph
hold off %ends hold on for the graph
%% Graph with plots vs equation
clc;clear;
x1 = -10:1:10; %parameters of the independent varianle x1
y1 = -3*x1+3; %equation one
hold on %hold because we are ploting two things on one plot
plot(x1,y1); %plot first equation
x2 = [-7 -4 -1 0 2 5 7]; %given plot data for x
y2 = [ 20 14 6 3 -2 -10 -15]; %given plot data for y
plot (x2,y2,'redo'); %plot the given data with red circles for the points
hold off %hold off
title('insert title of the plot') %title of the plot
xlabel('x') %x label
ylabel('y') %y label
legend('equation','Given data') %legend for equation one and the given data
 0:09:14
 0:03:55
 0:03:00
 0:04:11
 0:04:44
 0:00:45
 0:05:24
 0:09:10
 0:25:08
 0:04:01
 0:05:05
 0:04:42
 0:06:04
 0:05:08
 0:09:17
 0:39:18
 0:16:57
 0:05:43
 0:04:42
 0:02:45
 0:06:38
 0:11:47
 0:00:57
 0:06:48