filmov
tv
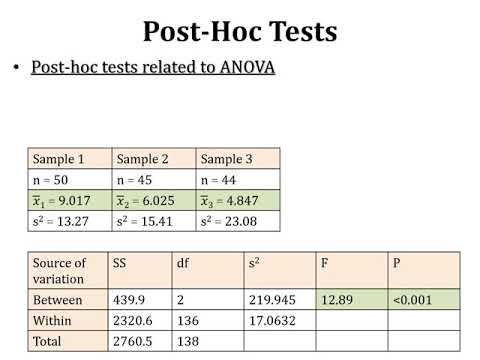
One-Way ANOVA with LSD (Least Significant Difference) Post Hoc Test in Excel

Показать описание
This video demonstrates how to conduct an ANOVA with a Fisher’s Least Significant Difference (LSD) post hoc test in Microsoft Excel. A comparison of the LSD in Excel is made to the SPSS output.
 0:10:13
One-Way ANOVA with LSD (Least Significant Difference) Post Hoc Test in Excel
 0:08:38
One-Way ANOVA: LSD confidence intervals
 0:14:15
Fisher's LSD Explained
 0:12:25
Performing the LSD Test Following One-Way ANOVA in SPSS | Least Significant Difference (LSD)
 0:08:30
Stats: Fishers LSD Protected T-test following One-Way ANOVA in Excel
 0:11:47
ANOVA with Fisher's Least Significant Difference (LSD) Post Hoc Test in SPSS
 0:32:51
Lecture 15 Fisher's Least Significant Difference One Way ANOVA Post Hoc Tests LSD Exercise
 0:16:45
How to find Least Significant Difference | post-hoc test | Fisher's Least Significant Differenc...
 0:09:37
Stats: Fisher's LSD Protected T-test in Excel following One-way ANOVA
 0:41:42
Lecture 14 One way ANOVA Fisher's Least Significant Difference Post Hoc Tests LSD
 0:07:51
Lecture 16 ANOVA LSD (Least Significant Difference) Unsolved Exercises; Post-Hoc Tests of ANOVA
 0:10:20
Post hoc test | Fisher's LSD – explained
 0:03:03
V7.6 - Protected Fishers LSD in SPSS
 0:11:56
One Way ANOVA and Bar Graph with LSD in R Program
 0:11:11
More one-way ANOVA (STAT 320 ch 5, video 2 of 2)
 0:10:24
Statistics Module 13 V2 - Single Factor ANOVA, Fisher's LSD, Problem 13-1Ab
 0:07:19
Least Significant Difference Test Step by Step numerical Solution| LSD test for Comparison of Mean
 0:05:45
Fisher's LSD - An Attractive and Underused Post-Hoc Test
 0:08:06
ANOVA 4 Multiple Comparisons Using Fisher's LSD
 0:13:42
ONE WAY ANOVA Followed by Fisher’s LSD Test Using Software, Minitab 19// Urdu
 0:41:42
LSD; Least Significant Difference; Post Hoc Test of ANOVA; Comparison of Means (Part A)
 0:36:46
Post-hoc Test (LSD and DMRT)
 0:12:34
LSD - What is the Least Significant Difference | Fisher's LSD | How to calculate LSD | After AN...
 0:24:41
Lecture 05: Latin Square Design (LSD) - ANOVA Model
Комментарии