filmov
tv
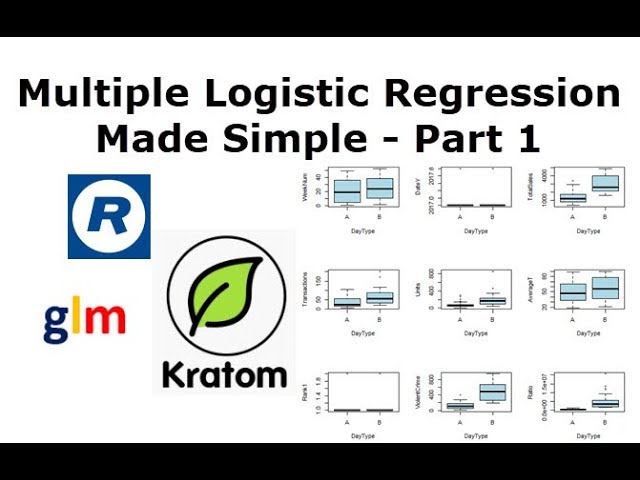
Multiple Logistic Regression and Predictive Analytics Made Simple in R - Part 1
Показать описание
This video is part 1 of the 5 part Multiple Logistic Regression in R. This video covers loading the dataset and the initial exploratory data analysis. This is an actual data science project and in this video series I will walk you through every aspect of it. The dataset used in this series is the Kratom store sales dataset from Kaggle.
You will see all of the code that I use in R Studio to do this multiple logistic regression analysis in r. We will find that some of the fields and external variables like violent crime and temperature can be used to predict the daytype (high sales (B) or low sales (A)).
In the end you will be left with a fully vetter and well tested process that uses predictive analytics to determine if a store will have high or low sales days (A or B type days). This process was originally built off proprietary data from my company and then I switched it to public data (kratom sales dataset) so I can share it with everyone.
Try all the code and my suggestion is to find a dataset that you like and has meaning to you. Then this learning will become far more interesting and meaningful to you. Also be sure and watch all of the videos in this logistic regression analysis series as there are lots of little cool tricks you will not want to miss!
Thanks for watching and I hope you found this helpful and interesting.
Please take a moment to subscribe, click the bell and like so that you will be notified of all my latest data science and tech related videos!
Thanks again and God bless!
 0:03:58
Logistic Regression in 3 Minutes
 0:13:22
Multiple Logistic Regression and Predictive Analytics Made Simple in R - Part 1
 0:08:48
StatQuest: Logistic Regression
 0:14:22
Logistic Regression [Simply explained]
 0:05:04
Linear Regression vs Logistic Regression - What's The Difference?
 0:21:11
Multiple Logistic Regression and Predictive Analytics Made Simple in R - Part 5
 0:07:07
Multiple Logistic Regression and Predictive Analytics Made Simple in R - Part 2
 0:08:55
Multiple Logistic Regression and Predictive Analytics Made Simple in R - Part 3
 0:27:55
REGRESSION | MACHINE LEARNING TECHNOLOGY | LECTURE 04 BY MS. SHERADHA JAUHARI | AKGEC
 0:16:51
Multiple logistic regression predicting good fit
 0:13:15
Multiple Logistic Regression and Predictive Analytics Made Simple in R - Part 4
 1:34:51
Predictive Modelling Using IBM SPSS: Multiple Logistic Regression
 0:02:33
Multiple Logistic Regression
 0:05:25
Multiple Regression, Clearly Explained!!!
 0:03:59
Why Linear regression for Machine Learning?
 0:02:09
Regression Analysis - Linear, Multiple and Logistic Regression
 0:18:14
Multivariable Logistic Regression in R: The Ultimate Masterclass (4K)!
 0:00:23
Understanding Logistic Regression for Classification #classification
 1:09:13
Regression Analysis | Full Course 2025
 0:00:19
Multi-Class Classification in Logistic Regression
 0:09:17
SPSS Tutorial: Multiple Logistic Regression
 0:02:56
Python Tutorial : Logistic regression
 0:17:31
Multiple Logistic Regression
 0:12:19
Multinomial logistic regression using SPSS (July, 2019)
Комментарии