filmov
tv
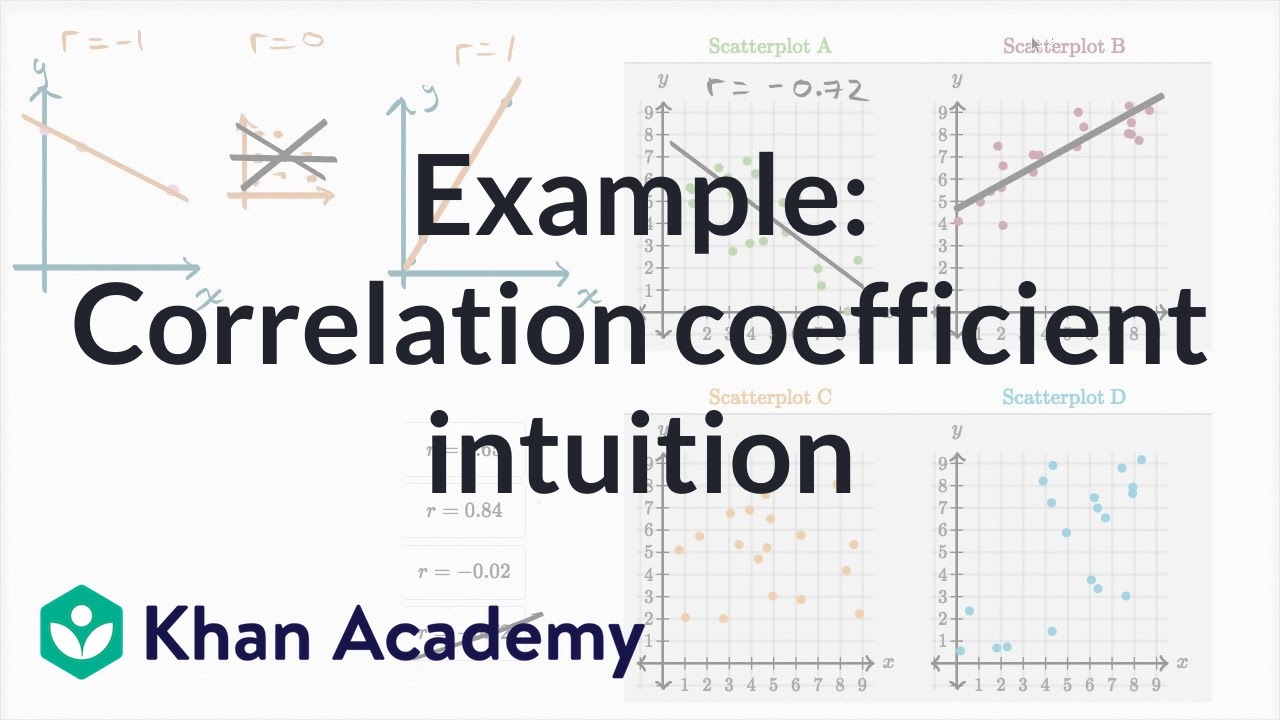
Example: Correlation coefficient intuition | Mathematics I | High School Math | Khan Academy
Показать описание
Sal explains the intuition behind correlation coefficients and does a problem where he matches correlation coefficients to scatter plots.
High School Math on Khan Academy: Did you realize that the word "algebra" comes from Arabic (just like "algorithm" and "al jazeera" and "Aladdin")? And what is so great about algebra anyway? This tutorial doesn't explore algebra so much as it introduces the history and ideas that underpin it.
For free. For everyone. Forever. #YouCanLearnAnything
 0:07:20
Example: Correlation coefficient intuition | Mathematics I | High School Math | Khan Academy
 0:07:21
Example: Correlation Coefficient Intuition
 0:03:40
Khan Academy Correlation coefficient intuition practice
 0:12:57
Correlation Coefficient
 0:10:18
The Correlation Coefficient Simplified | Intuition
 0:07:21
Math Statistics and probability - Example Correlation coefficient intuition
 0:11:48
Correlation coefficient intuition : Khan Academy
 0:04:46
Correlation Coefficient Intuition
 0:06:45
MI 7.1.5 Correlation Coefficient Intuition
 0:07:50
Pearson correlation [Simply explained]
 0:10:39
Correlation Coefficient - Intuition Explained
 0:09:17
Pearson's Correlation Coefficient (1 of 3: Unpacking the formula)
 0:06:54
The Correlation Coefficient - Explained in Three Steps
 0:12:22
Calculating correlation coefficient r | AP Statistics | Khan Academy
 0:04:18
Introduction to Correlation (Statistics)
 0:06:47
Correlation Coefficient (r) Concept an Examples
 0:00:21
R Intuition - Intro to Statistics
 0:07:26
Khan Academy Correlation Intuition
 0:25:07
CORRELATION AND COVARIANCE: SIMPLE VISUAL EXPLANATION OF USEFUL COEFFICIENT IN STATISTICS, ML, AI
 0:07:47
Covariance Clearly Explained!
 0:13:02
Maths Tutorial: Pearson's correlation coefficient (statistics)
 0:05:32
Correlation Example
 0:03:36
Estimate the Correlation Coefficient Given a Scatter Plot
 0:08:17
Correlation Coefficient
Комментарии