filmov
tv
Transport Logistics Dashboard with Automated Insights

Показать описание
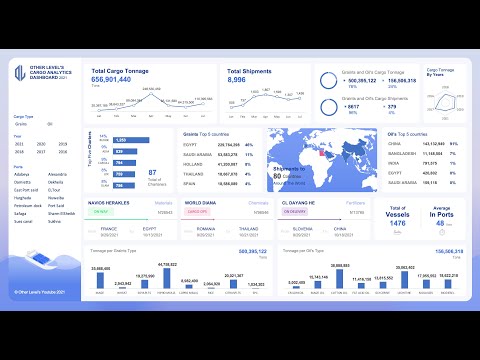
This is an automated dashboard solution developed for a transport shipment company to streamline logistics operations. The dashboard provides critical insights into shipment data, empowering stakeholders to make informed decisions effortlessly.
It features a dynamic auto refresh which is set to occur every 8 hours ensuring real time updates on order statuses, delivery performance, and cost metrics. This dashboard also captures Shipment Analytics by tracking total distance covered in the course of deliveries, weight shipped , and the total cost of logistics operations. Visualizes order statuses (delivered, pending, and in-transit) to monitor progress and identify bottlenecks.
Documents Performance Metrics by calculating the percentage of on-time deliveries against a 90% target. Highlights average delivery times and trends across months to improve future planning. Optimized Cost and Route by displays routes with their total costs, distances, and frequency rankings to optimize operational efficiency. It has also integrated Geospatial Data showing transport type distribution (airplane, ship, train, and truck), along with pickup and delivery locations, for better regional analysis.
Users can filter by transport type, order statuses, and time periods for detailed and actionable insights.
Purpose:
This automated dashboard aims to enhance logistics efficiency by providing visibility into operational performance, tracking shipments, and identifying improvement opportunities through real-time analytics.
 0:00:37
 0:00:37
 0:00:51
 0:00:59
 0:57:09
 0:30:37
 0:00:15
 0:00:18
 0:01:30
 0:00:15
 0:01:19
 0:18:56
 0:01:18
 0:32:54
 0:03:21
 0:09:17
 0:00:27
 0:00:16
 1:20:18
 0:00:16
 0:00:34
 0:07:08
 0:03:36
 0:02:50