filmov
tv
Linear and Logistic Regression in R|Linear Regression|Logistic Regression

Показать описание
Linear and Logistic Regression in R
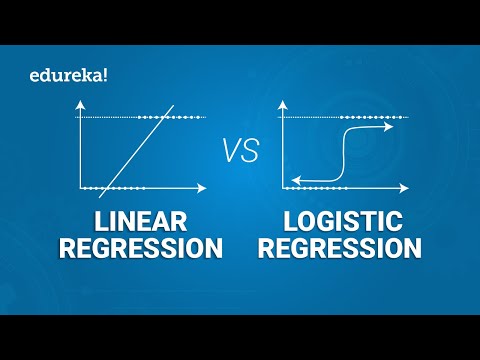
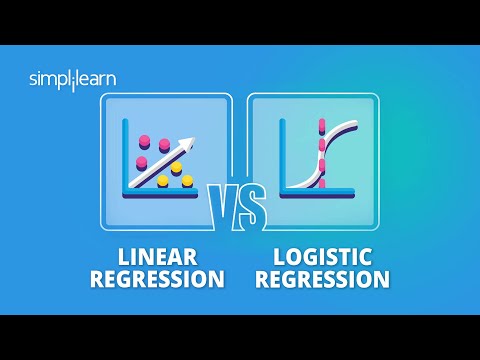
Linear Regression
Logistic Regression
Linear Regression
Used to predict the continuous dependent variable using a given set of independent variables.
The outputs produced must be a continuous value, such as price and age.
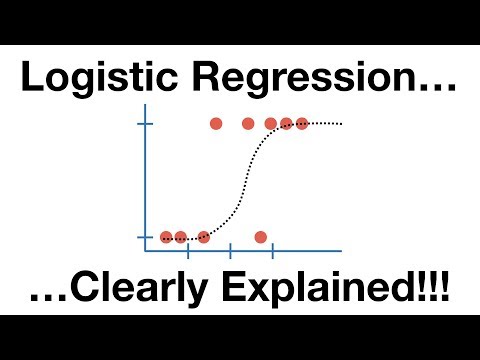
Logistic Regression
Used to predict the categorical dependent variable using a given set of independent variables.
The outputs produced must be Categorical values such as 0 or 1, Yes or No.
# Generate random IQ values with mean = 30 and sd =2
IQ = rnorm(40, 30, 2)
# Sorting IQ level in ascending order
IQ = sort(IQ)
# Generate vector with pass and fail values of 40 students
result = c(0, 0, 0, 1, 0, 0, 0, 0, 0, 1,
1, 0, 0, 0, 1, 1, 0, 0, 1, 0,
0, 0, 1, 0, 0, 1, 1, 0, 1, 1,
1, 1, 1, 0, 1, 1, 1, 1, 0, 1)
# Data Frame
# Print data frame
print(df)
# Plotting IQ on x-axis and result on y-axis
plot(IQ, result, xlab = "IQ Level",
ylab = "Probability of Passing")
# Create a linear model
Ln = glm(result~IQ, data= df)
summary(Ln)
# Create a logistic model
Lg= glm(result~IQ, family=binomial, data= df)
# Summary of the regression model
summary(Lg)
# Create a curve based on prediction using the linear model
# Create a curve based on prediction using the regression model
plot(lgp)
or 1, Yes or No.
Linear Regression
Logistic Regression
Linear Regression
Used to predict the continuous dependent variable using a given set of independent variables.
The outputs produced must be a continuous value, such as price and age.
Logistic Regression
Used to predict the categorical dependent variable using a given set of independent variables.
The outputs produced must be Categorical values such as 0 or 1, Yes or No.
# Generate random IQ values with mean = 30 and sd =2
IQ = rnorm(40, 30, 2)
# Sorting IQ level in ascending order
IQ = sort(IQ)
# Generate vector with pass and fail values of 40 students
result = c(0, 0, 0, 1, 0, 0, 0, 0, 0, 1,
1, 0, 0, 0, 1, 1, 0, 0, 1, 0,
0, 0, 1, 0, 0, 1, 1, 0, 1, 1,
1, 1, 1, 0, 1, 1, 1, 1, 0, 1)
# Data Frame
# Print data frame
print(df)
# Plotting IQ on x-axis and result on y-axis
plot(IQ, result, xlab = "IQ Level",
ylab = "Probability of Passing")
# Create a linear model
Ln = glm(result~IQ, data= df)
summary(Ln)
# Create a logistic model
Lg= glm(result~IQ, family=binomial, data= df)
# Summary of the regression model
summary(Lg)
# Create a curve based on prediction using the linear model
# Create a curve based on prediction using the regression model
plot(lgp)
or 1, Yes or No.
 0:05:04
 0:20:27
 0:03:48
 0:09:38
 0:08:48
 0:37:06
 0:14:22
 0:02:34
 0:02:26
 0:04:37
 0:10:34
 0:13:10
 0:07:16
 0:45:17
 0:05:30
 0:06:27
 0:08:14
 0:12:40
 0:06:40
 0:08:02
 0:11:01
 0:10:01
 0:19:28
 0:09:14