filmov
tv
Scatter Plots & Bubble Plots in Python | Matplotlib Tutorial Part 4 | Correlation with Scatter Plots

Показать описание
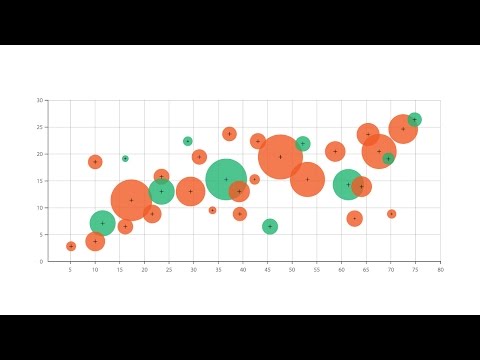
Another way of converting your continuous variables to charts is to scatter plots. Scatter plots require two continuous variables in order to plot them and hence they are bivariate.
Scatter plots are also very common in practice when it comes to identifying if there exists a relationship between variables or not. They can also depict if two continuous variables have a positive correlation, negative correlation, or no correlation.
**ADVANTAGES:**
1. Highlights correlation
2. Often depicts minimum, maximum, and outliers in the data.
3. Shows if there is a trend in the data.
**DISADVANTAGES:**
1. Only applicable to continuous variables.
2. Sometimes the results are inconclusive.
#scatterplots #bubbleplots #matplotlib
 0:06:59
How To Create A Bubble Plot In Excel (With Labels!)
 0:07:09
Science of Data Visualization | Bar, scatter plot, line, histograms, pie, box plots, bubble chart
 0:10:24
Scatter Plot and Bubble plot in Details in Python's Matplotlib and Seaborn
 0:08:05
Mastering Excel: Create Stunning Bubble Charts!
 0:02:53
How to Make a Bubble Plot in R
 0:09:42
Scatter chart and bubble chart (think-cell tutorials)
 0:15:56
Create Motion Bubble Charts & Scatter Plots in Excel
 0:01:58
Scatter/bubble chart
 0:02:23
A Guide to Bubble Charts
 0:10:28
Scatter Plots and Bubble charts
 0:11:18
4 types of analysis with Motion Bubble Charts & Scatter Plots
 0:06:36
5.5 How to create Scatter Plot in Power BI | Power BI Tutorials for Beginners | By Pavan Lalwani
 0:04:53
How To Create Bubble Chart in Excel | Bubble Ghraph In Microsoft Excel | DataWitzz
 0:06:33
Data Visualization : Scatter Plot Explained with Example in Hindi
 0:02:31
Excel scatter plot with group colouring
 0:00:54
How to Make a Scatter Plot in Excel
 0:12:44
Introduction to Bubble Chart and 4 types of analysis with examples
 0:03:40
World map scatter and bubble chart in Excel
 0:02:14
How to Add the Series Name onto a Scatter or Bubble Chart
 0:01:25
Scatter and Bubble Charts in Graphext
 0:02:51
Creating Scatter Plot and Bubble Chart in PowerBI
 0:46:23
Dynamic Power BI SCATTERPLOTS: Visual Deep-Dive!!!
 0:03:42
Bubble/Scatterplot Custom Visual - Advanced Key Features of the Power BI Visual.
 0:25:49
Use scatterplots to find details in Power BI reports
Комментарии