filmov
tv
Normal Distribution, Z Scores, and Normal Probabilities in R | R Tutorial 3.3| MarinStatslectures

Показать описание
In this R video tutorial, we will learn to calculate probabilities for Z scores. we will also learn to calculate probabilities for a normal distribution using pnorm, dnorm, rnorm, and qnorm functions in R Software. This R tutorial will also show you how to draw the probability density curve for a normal variable.
This video is a tutorial for programming in R Statistical Software for beginners using RStudio.
►► Watch More:
Follow MarinStatsLectures
Our Team:
Content Creator: Mike Marin (B.Sc., MSc.) Senior Instructor at UBC.
Producer and Creative Manager: Ladan Hamadani (B.Sc., BA., MPH)
These videos are created by #marinstatslectures to support some statistics courses at the University of British Columbia (UBC) (#IntroductoryStatistics and #RVideoTutorials ), although we make all videos available to the everyone everywhere for free.
Thanks for watching! Have fun and remember that statistics is almost as beautiful as a unicorn!
#statistics #rprogramming
 0:06:57
Z-Scores, Standardization, and the Standard Normal Distribution (5.3)
 0:05:21
Normal Distribution: Calculating Probabilities/Areas (z-table)
 0:51:03
Standard Normal Distribution Tables, Z Scores, Probability & Empirical Rule - Stats
 0:14:08
z-Score, z-Standardization, Standard Normal Distribution, z-Distribution Table - Simply explained
 0:07:09
Finding Areas Under And What Is The Standard Normal Distribution Curve And Z Scores Explained
 0:05:13
The Normal Distribution, Clearly Explained!!!
 0:19:07
Intro to Standard Z-Score & Normal Distribution in Statistics
 0:10:59
Normal Distribution EXPLAINED with Examples
 10:33:16
Statistical distributions full course part 8
 0:05:05
Z-score introduction | Modeling data distributions | AP Statistics | Khan Academy
 0:07:48
ck12.org normal distribution problems: z-score | Probability and Statistics | Khan Academy
 0:03:28
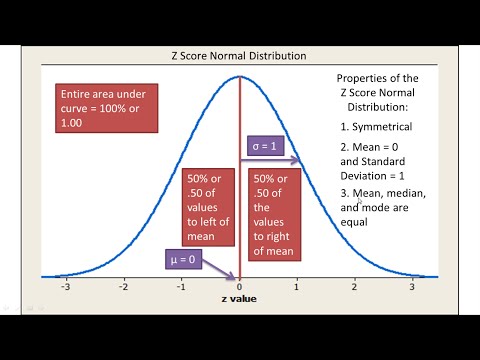
Normal Distribution and z Scores Explained - Introductory Statistics
 0:06:18
Z Scores and Normal Distributions (Example Problems)
 0:10:55
Z-Scores and Percentiles: Crash Course Statistics #18
 0:08:50
The Normal Distribution and the 68-95-99.7 Rule (5.2)
 0:04:51
Normal Distribution: Find Probabilities Given Z-scores Using Table (Left of Z-score)
 0:19:48
Normal Distribution and Z Score | Math, Statistics for data science, machine learning
 0:07:26
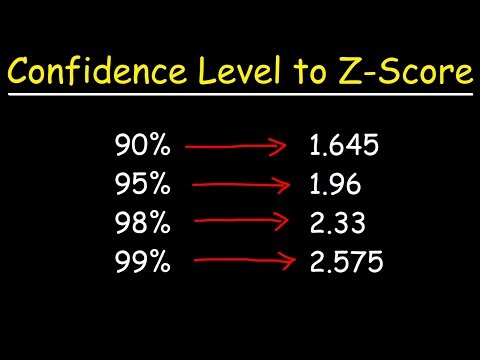
How To Find The Z Score Given The Confidence Level of a Normal Distribution 2
 0:03:16
What Are And How To Calculate Z Scores - Z Score Statistics Formula Explained
 0:11:59
Tutorial 24-Z Score Statistics Data Science
 0:29:30
Normal Distribution & Probability Problems
 0:03:46
Normal Distribution - z Scores and Probabilities | TI-30XPlus MathPrint calculator
 0:09:26
Normal Distribution, Z-Scores & Empirical Rule | Statistics Tutorial #3 | MarinStatsLectures
 0:06:27
Y11-12 Mathematics: Z-Scores and the Standard Normal Distribution
Комментарии