filmov
tv
Python Tutorial : Dataframes and Series

Показать описание
---
Welcome to Exploratory Data Analysis in Python! I'm Allen Downey and I'll be your instructor. The goal of exploratory data analysis is to use data to answer questions and guide decision making.
As a first example, we'll start with a simple question: what is the average birth weight of babies in the United States?
To answer a question like this, we have to find an appropriate dataset or run an experiment to collect it. Then we have to get the data into our development environment and prepare it for analysis, which involves cleaning and validation.
For this question we'll use data from the National Survey of Family Growth, which is available from the National Center for Health Statistics.
The 2013-2015 dataset includes information about a representative sample of women in the U.S. and their children.
The Python module we'll use to read and analyze data is Pandas, which we'll import as `pd`.
Pandas can read data in most common formats, including CSV, Excel, and the format the NSFG data is in, HDF5.
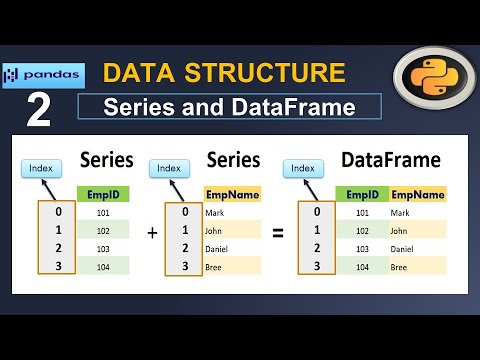
The result from read_hdf() is a DataFrame, which is the primary data structure Pandas uses to store data.
head() shows the first 5 rows of the DataFrame, which contains one row for each pregnancy for each of the women who participated in the survey, and one column for each variable.
The DataFrame has an attribute called shape, which is the number of rows and columns; there are 9358 rows in this dataset, one for each pregnancy, and 10 columns, one for each variable.
The DataFrame also has an attribute called `columns`, which is an Index. That's another Pandas data structure, similar to a list; in this case it's a list of variables names, which are strings.
Based on the names, you might be able to guess what some of the variables are, but in general you have to read the documentation.
In many ways a DataFrame is like a Python dictionary, where the variable names are the keys and the columns are the values. You can select a column from a DataFrame using the bracket operator, with a string as the key.
The result is a Series, which is another Pandas data structure. In this case the Series contains the birth weights, in pounds, of the live births (or in the case of multiple births, the first baby).
head() shows the first five values in the series, the name of the series, and the datatype; float64 means that these values are 64-bit floating-point numbers.
Notice that one of the values is NaN, which stands for "Not a Number". NaN is a special value that can indicate invalid or missing data. In this example, the pregnancy did not end in live birth, so birth weight is inapplicable.
Let's start exploring this data by working on some exercises.
#DataCamp #PythonTutorial #ExploratoryDataAnalysisinPython
 0:04:44
Python Tutorial: DataFrames and their methods
 0:20:58
Python Pandas Tutorial 2: Dataframe Basics
 1:34:11
Complete Python Pandas Data Science Tutorial! (2025 Updated Edition)
 1:00:27
Complete Python Pandas Data Science Tutorial! (Reading CSV/Excel files, Sorting, Filtering, Groupby)
 0:13:31
LEARN PANDAS in about 10 minutes! A great python module for Data Science!
 0:09:17
Pandas Tutorial #1 - DataFrames (Python für Data Science)
 0:17:30
PANDAS PYTHON Français - Introduction + Analyse du Titanic (17/30)
 0:20:01
Python: Pandas Tutorial | Intro to DataFrames
 0:03:22
PySpark Coding Interview Problem #6 | Real-World Scenario | Crack Data Engineer Interviews
 0:18:18
Learn how to use PANDAS in Python in 15 minutes - with 10 real examples
 0:26:46
Pandas Dataframe Tutorial | Dataframe In Pandas | Python Pandas Tutorial | Python Basics|Simplilearn
 0:33:35
Python Pandas Tutorial (Part 2): DataFrame and Series Basics - Selecting Rows and Columns
 1:06:27
Pandas Full Python Course - Data Science Fundamentals
 0:00:10
I Create Excel file in 5sec using Python || python excel || python pandas || python to excel #python
 0:00:29
Python in Excel‼️ #excel #python
 0:20:52
Basic Guide to Pandas! Tricks, Shortcuts, Must Know Commands! Python for Beginners
 0:15:52
Python Pandas Tutorial : Series and DataFrame Basics #2
 0:14:12
Polars: The Next Big Python Data Science Library... written in RUST?
 0:16:59
SQL Databases with Pandas and Python - A Complete Guide
 0:02:56
Python Tutorial: Merging DataFrames with pandas (part 1)
 0:00:34
How to Read a CSV file into a Pandas DataFrame | Pandas Tutorial for Beginners
 0:00:28
Selecting rows and columns from DataFrame in pandas
 0:40:03
Python Pandas Tutorial (Part 5): Updating Rows and Columns - Modifying Data Within DataFrames
 0:00:34
Create a multiindex from pandas dataframe in Python | Python Data Science | Python Coding Tutorial
Комментарии