filmov
tv
Data Science & Machine Learning - RMSE & R-Squared - DIY- 13 -of-50
Показать описание
Data Science & Machine Learning - RMSE & R-Squared - DIY- 13 -of-50
Do it yourself Tutorial
by
Bharati DW Consultancy
cell: +1-562-646-6746 (Cell & Whatsapp)
RMSE / RMSD
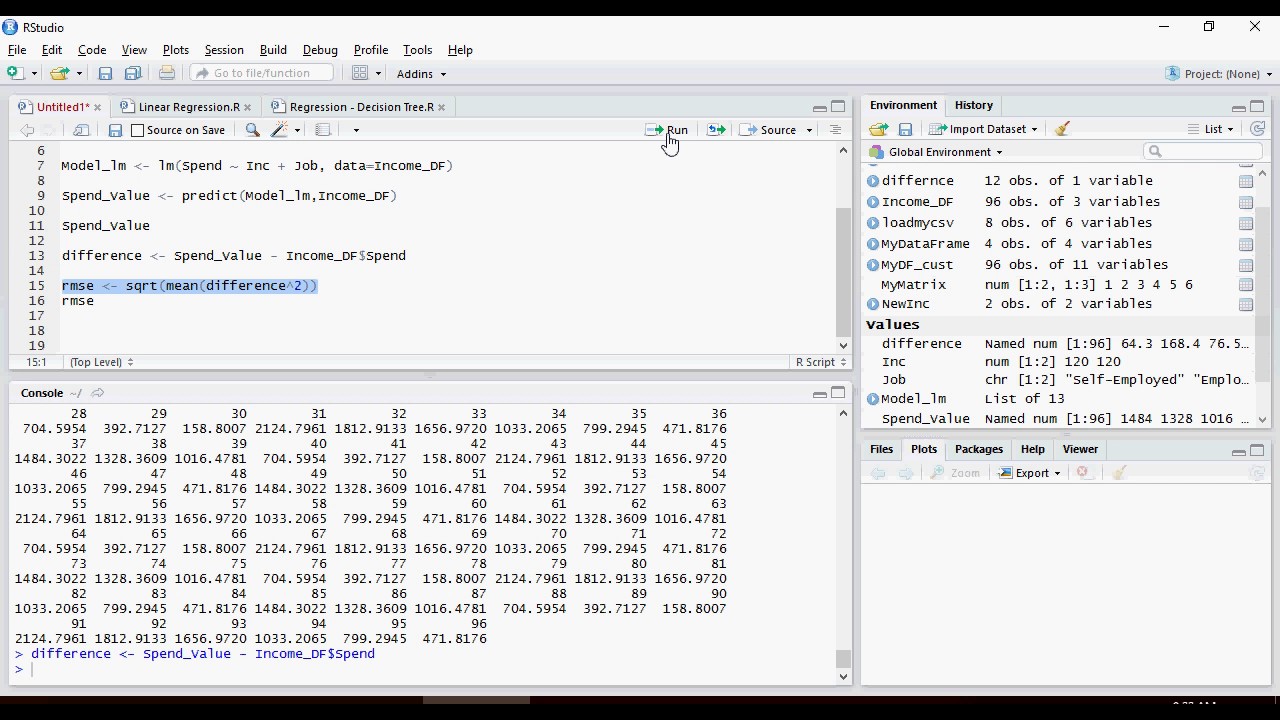
The root-mean-square deviation (RMSD) or root-mean-square error (RMSE) is a very commonly used measure of the differences between predicted values by a model and the actual values seen in the data.
The square root of the mean/average of the square of all of the error.
It compares the forecasting errors of various models for a target variable.
RMSE (angle brace)- sqrt(mean((predicted – actual) ^2));
R-Squared
R-squared is a statistical measure of how close the data are to the fitted regression line. It is also known as the coefficient of determination, or the coefficient of multiple determination for multiple predicted values.
R-squared is conveniently scaled between 0 and 1, whereas RMSE is not scaled to any particular values.
You would want R-Squared closer to 1.
Hands On – R Machine Learning Ex-10
Implement Simple & Multiple Linear Regression Model for target variable - Spend using predictor variables Age, Income, Job, Auto Loan Indicator, Gender, Marital Status.
Note RMSE for each additional variable.
Data Science & Machine Learning - Getting Started - DIY- 1 -of-50
Data Science & Machine Learning - R Data Structures - DIY- 2 -of-50
Data Science & Machine Learning - R Data Structures - Factors - DIY- 3 -of-50
Data Science & Machine Learning - R Data Structures - List & Matrices - DIY- 4 -of-50
Data Science & Machine Learning - R Data Structures - Data Frames - DIY- 5 -of-50
Data Science & Machine Learning - Frequently used R commands - DIY- 6 -of-50
Data Science & Machine Learning - Frequently used R commands contd - DIY- 7 -of-50
Data Science & Machine Learning - Installing RStudio- DIY- 8 -of-50
Data Science & Machine Learning - R Data Visualization Basics - DIY- 9 -of-50
Data Science & Machine Learning - Linear Regression Model - DIY- 10(a) -of-50
Data Science & Machine Learning - Linear Regression Model - DIY- 10(b) -of-50
Data Science & Machine Learning - Multiple Linear Regression Model - DIY- 11 -of-50
Data Science & Machine Learning - Evaluate Model Performance - DIY- 12 -of-50
Data Science & Machine Learning - RMSE & R-Squared - DIY- 13 -of-50
machine learning, data science, R programming, Deep Learning, Regression, Neural Network, R Data Structures, Data Frame, RMSE & R-Squared
Do it yourself Tutorial
by
Bharati DW Consultancy
cell: +1-562-646-6746 (Cell & Whatsapp)
RMSE / RMSD
The root-mean-square deviation (RMSD) or root-mean-square error (RMSE) is a very commonly used measure of the differences between predicted values by a model and the actual values seen in the data.
The square root of the mean/average of the square of all of the error.
It compares the forecasting errors of various models for a target variable.
RMSE (angle brace)- sqrt(mean((predicted – actual) ^2));
R-Squared
R-squared is a statistical measure of how close the data are to the fitted regression line. It is also known as the coefficient of determination, or the coefficient of multiple determination for multiple predicted values.
R-squared is conveniently scaled between 0 and 1, whereas RMSE is not scaled to any particular values.
You would want R-Squared closer to 1.
Hands On – R Machine Learning Ex-10
Implement Simple & Multiple Linear Regression Model for target variable - Spend using predictor variables Age, Income, Job, Auto Loan Indicator, Gender, Marital Status.
Note RMSE for each additional variable.
Data Science & Machine Learning - Getting Started - DIY- 1 -of-50
Data Science & Machine Learning - R Data Structures - DIY- 2 -of-50
Data Science & Machine Learning - R Data Structures - Factors - DIY- 3 -of-50
Data Science & Machine Learning - R Data Structures - List & Matrices - DIY- 4 -of-50
Data Science & Machine Learning - R Data Structures - Data Frames - DIY- 5 -of-50
Data Science & Machine Learning - Frequently used R commands - DIY- 6 -of-50
Data Science & Machine Learning - Frequently used R commands contd - DIY- 7 -of-50
Data Science & Machine Learning - Installing RStudio- DIY- 8 -of-50
Data Science & Machine Learning - R Data Visualization Basics - DIY- 9 -of-50
Data Science & Machine Learning - Linear Regression Model - DIY- 10(a) -of-50
Data Science & Machine Learning - Linear Regression Model - DIY- 10(b) -of-50
Data Science & Machine Learning - Multiple Linear Regression Model - DIY- 11 -of-50
Data Science & Machine Learning - Evaluate Model Performance - DIY- 12 -of-50
Data Science & Machine Learning - RMSE & R-Squared - DIY- 13 -of-50
machine learning, data science, R programming, Deep Learning, Regression, Neural Network, R Data Structures, Data Frame, RMSE & R-Squared
 0:02:35
Machine Learning Explained in 100 Seconds
 0:00:53
Reality behind data science, machine learning jobs
 1:11:05
Machine Learning Algorithms | Machine Learning Tutorial | Data Science Algorithms | Simplilearn
 0:45:16
Machine Learning Algorithms | Machine Learning Tutorial | Data Science Training | Edureka
 0:00:26
I can't STOP reading these Machine Learning Books!
 0:07:52
Machine Learning | What Is Machine Learning? | Introduction To Machine Learning | 2024 | Simplilearn
 0:07:51
What is Data Science?
 0:06:38
AI vs ML vs DL vs Data Science - Difference Explained | Simplilearn
 1:01:34
AI & Data Science Chat With A Chief Data Scientist - LIVE AI & Data Science Discussion
 0:03:45
Artificial Intelligence (AI) vs Machine Learning vs Deep Learning vs Data Science
 0:13:35
Data Scientist vs Machine Learning Engineer | DS vs ML
 0:09:45
AI VS ML VS DL VS Data Science
 0:08:10
Data Science vs Machine Learning – What's The Difference | Data Science Tutorial | Simplilearn...
 1:45:39
Live Day 1- Introduction To Machine Learning Algorithms For Data Science
 0:05:49
AI vs Machine Learning
 0:10:39
Data Scientist vs. AI Engineer
 0:02:38
PHD in machine learning or data science, is it worth?
 0:06:30
Data Analytics vs Data Science
 0:51:31
11. Introduction to Machine Learning
 0:14:50
AI vs Machine Learning vs Deep Learning | AI vs ML vs DL - Differences Explained | Edureka
 0:49:43
Python Machine Learning Tutorial (Data Science)
 0:10:54
Machine Learning Engineer VS Data Scientist
 0:10:00
What is Machine Learning in Data Science- Machine Learning Tutorial with Python and R-Part 1
 0:17:15
Machine Learning And Deep Learning Interview Questions For Data Science Interview | Simplilearn
Комментарии