filmov
tv
Given graph of a function with rectangles representing a Riemann sum, find the total area.

Показать описание
Question: The rectangles in the graph below illustrate a left endpoint Riemann sum for f(x) = 3sin x on the interval [0, π]. The value of this Riemann sum is (?).
a) The rectangles in the graph below illustrate a left endpoint Riemann sum for f(x) = 3sin x on the interval [0, π]. The value of this Riemann sum is (?).
Left endpoint Riemann sum for y = 3sin x on [0, π]
b) The rectangles in the graph below illustrate a right endpoint Riemann sum for f(x) = 3sin x on the interval [0, π]. The value of this Riemann sum is (?).
Right endpoint Riemann sum for y = 3sin x on [0, π]
------------------------
Answered By:
Doug C.
Math Tutor with Reputation to make difficult concepts understandable
------------------------
Written Explanation:
------------------------
About: Wyzant Ask an Expert offers free answers to your toughest academic and professional questions from over 65,000 verified experts. It’s trusted by millions of students each month with the majority of questions receiving an answer within 1 hour of being asked. If you ever need more than just an answer, Wyzant also offers personalized 1-on-1 sessions with experts that will work with you to help you understand whatever you’re trying to learn.
 0:04:29
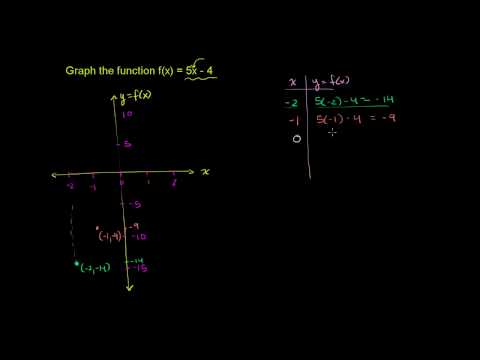
Evaluate a Function from a Graph
 0:05:36
Graphing a Basic Function
 0:00:44
Evaluating functions given their graph | Functions and their graphs | Algebra II | Khan Academy
 0:13:24
Domain and Range of a Function From a Graph
 0:04:09
Given fx sketch the first and second derivative graph
 0:06:20
Sine or Cosine Writing Equations Given Graph
 0:07:39
Draw the Function given Graph of Derivative
 0:05:34
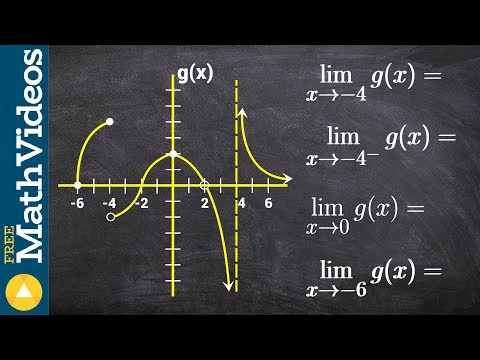
Evaluate all the limits from a given graph
 0:05:44
Finding Quartic Functions From Its Graph
 0:05:32
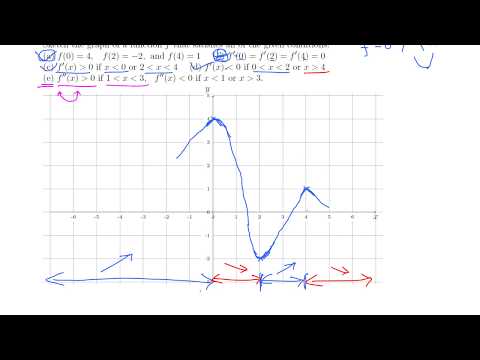
Calc I: Sketching a graph of a function given some properties (medium)
 0:04:41
Ex: Sketch the Graph of a Derivative Function Given the Graph of a Function
 0:09:35
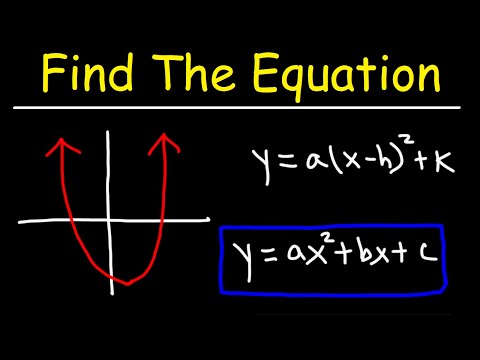
How To Find The Equation of a Quadratic Function From a Graph
 0:03:06
Functions: Determine if the graph is a function or not.
 0:08:44
Sketching a Derivative from the Graph of a Function
 0:01:06
How to match function input to output given the graph (example) | Algebra I | Khan Academy
 0:03:04
Ex: Give the Domain and Range Given the Graph of a Function
 0:01:48
How to find two function inputs with the same output given graph (example) | Khan Academy
 0:02:26
Ex 1: Determine a Function Value From a Graph
 0:03:50
Find the Equation of a Piecewise Function Given a Graph
 0:03:45
How to write a piecewise function from a given graph - Homework help online
 0:05:59
Graph Transformation of a Function from a Graph
 0:05:48
Calc I: Sketching a graph from given conditions
 0:06:06
Draw Graph of Derivative given Graph of Original Function
 0:03:04
Graph function given limits
Комментарии