filmov
tv
Infography Review: How to Create Infographics in One Click!
Показать описание
Welcome to Infography review!
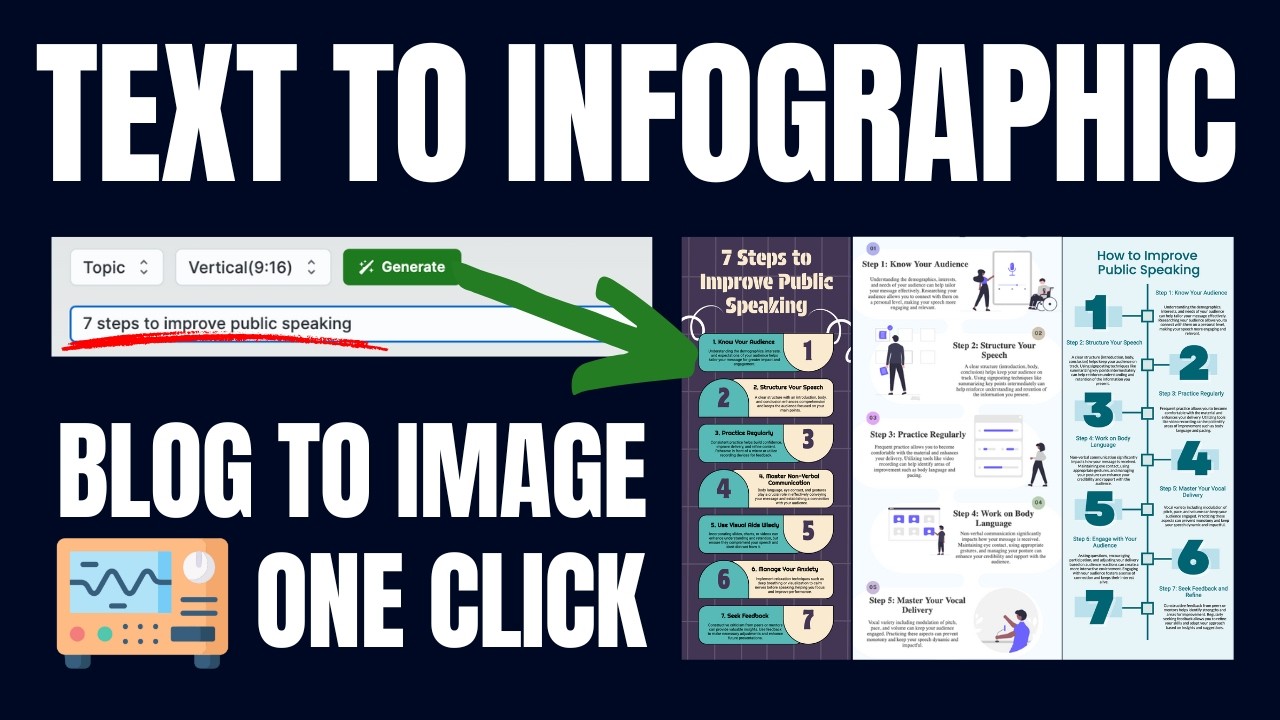
🚀 Do you want to transform your blog posts into stunning, shareable infographics without the hassle of designing from scratch? In this video, you'll learn how to create engaging infographics using Infography tool powered by AI. Infography In allows you to convert complex blog content into visually appealing infographics that simplify information, boost engagement, and increase shares. Just enter your blog details, or any text or topic, and let Infography software handle the rest!
Chapters:
0:00 - Introduction to Infography
0:43 - Use Cases Introduction
1:03 - Main Benefit: Repurpose Existing Content
1:14 - Example: Blog Post Conversion
1:43 - Why Use Infography?
2:35 - How to Use Infography
3:26 - Infographic Generation Example
4:23 - Editing Infographics
5:34 - Download and Share Infographics
7:56 - Generating Infographics for a Product
8:55 - Real-World Examples (Pinterest, Blog, Twitter/X)
10:45 - Pros of Infography
11:30 - Cons of Infography
14:06 - Roadmap and Future Features
15:05 - Lifetime Deal
19:17 - Conclusion
22:23 - Final Thoughts
🎨 Infographics are vibrant and easy-to-understand graphics that make complicated information more accessible. By combining images, text, and charts, infographics present data in a clear and interesting way. Using infographics can help make information more memorable, drive higher engagement, and enhance brand recognition. They're especially effective at visualizing statistics, tutorials, and product comparisons. Infographics excel both online and offline, and can even improve your website's SEO. In short, they are powerful tools that make sharing ideas easier and more fun!
Infography infographic generator turns your blogs into stunning, shareable infographics. Convert your complex blog posts into visually engaging infographics that simplify information, boost engagement, and skyrocket shares.
Inphography App Use Cases
🌐 Reach New Audiences: Repurpose content effortlessly and attract leads with this powerful tool.
📊 Simplify Complex Information: Break down complex topics with visuals, icons, and charts. Perfect for statistics, tutorials, or product comparisons.
🔄 Increase Engagement and Shareability: Infographics are more engaging than text alone, making them more likely to be shared and remembered.
📣 Attract Attention on Social Media: Eye-catching infographics perform well on platforms like Pinterest, Facebook, and Twitter. Grab attention and drive traffic back to your blog or website.
🛍️ Promote Specific Products or Services: Highlight key features and benefits in a visually appealing way.
♻️ Repurpose Existing Content: Convert existing blog posts into infographics to extend their reach without creating entirely new content.
🔍 Improve SEO: Include relevant keywords in your infographic to improve your search engine ranking.
Комментарии