filmov
tv
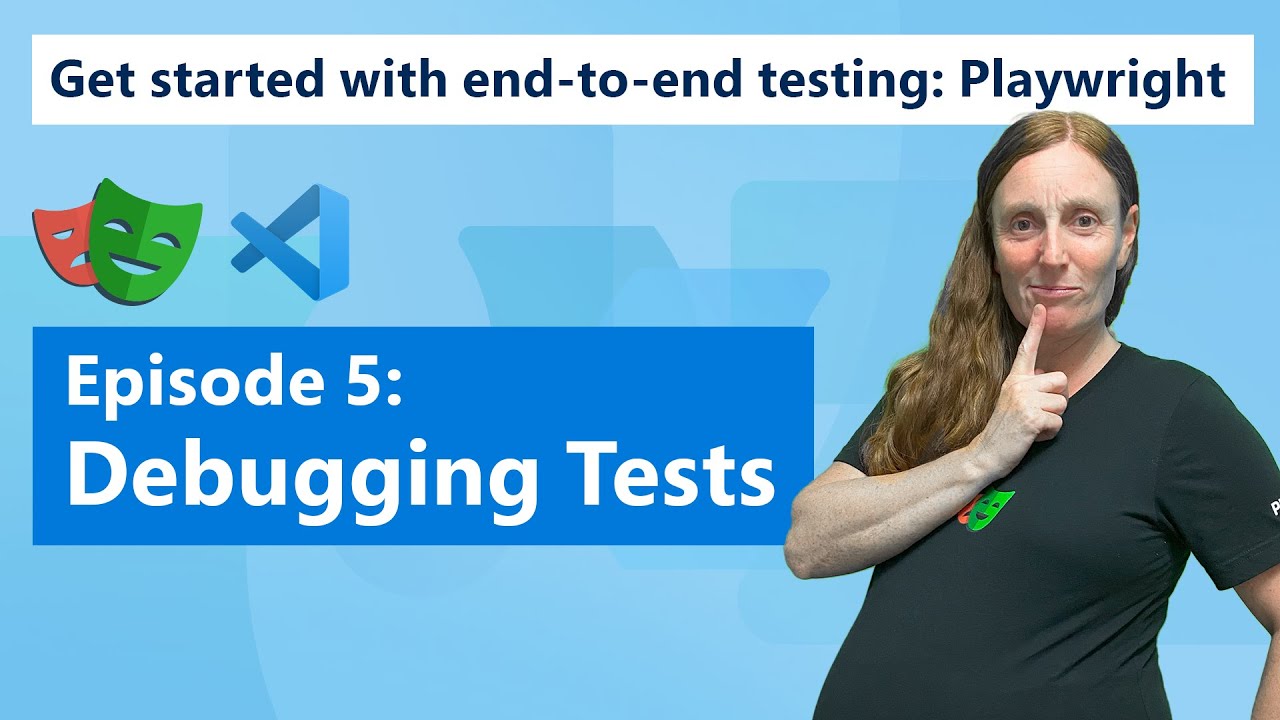
Get started with end-to-end testing: Playwright | Episode 5 - Debugging Tests

Показать описание
Let’s learn how to debug our failing test right in VS Code with live debugging and break points as well as debugging using the show trace option to see a full trace of our test. From the trace we can see a DOM snapshot of each action of our test and use the pick locator feature to ensure we are using the right locator for the element that’s failing.
Playwright Series Playlist:
Chapters:
00:00 In this episode
00:28 Debugging in VS Code
01:25 Locator docs
01:32 Setting Breakpoints
02:33 Using the Trace Viewer
05:12 Up Next: Running tests on CI
Links:
VS Code Extension:
Playwright docs VS Code:
Playwright’s trace viewer:
Playwright on Discord:
#playwright #playwrightdev #vscode
End to End Testing - Explained
Cypress in 100 Seconds
Software Testing Explained in 100 Seconds
Static, Unit, Integration, and End-to-End Tests Explained - Software Testing Series #1
Introduction to Front End Testing
How to use Cypress to write E2E Tests over a Registration Page
Brief guide to end-to-end testing
Software Testing Tutorial #28 - End to End Testing in Software Testing
What Is End To End Testing?
GETTING STARTED WITH CYPRESS.IO - UI End to End Testing
How To Perform End To End Testing With Selenium | Selenium Tutorial🔍| LambdaTest
5 Types of Testing Software Every Developer Needs to Know!
It's end-to-end testing time!
Don’t Do E2E Testing!
Cypress Testing with React - Simple Tutorial
Quick Start Vue.js With Cypress End-To-End Testing For Beginners
Test-Driven Development // Fun TDD Introduction with JavaScript
Cypress End-to-End Testing
End to End Testing in 60 Seconds 🔥 #shorts
What is end to end testing | Cypress introduction
JavaScript Testing Introduction Tutorial - Unit Tests, Integration Tests & e2e Tests
Introduction To Testing In JavaScript With Jest
What is E2E Testing?
The Two Types of End-to-End Testing: Horizontal and Vertical
Комментарии
 0:06:44
 0:02:31
 0:02:16
 0:13:45
 0:25:32
 0:12:53
 0:01:32
 0:19:08
 0:06:27
 0:16:43
 1:09:15
 0:06:24
 0:01:31
 0:17:59
 0:12:43
 0:09:51
 0:12:55
 0:09:34
 0:00:59
 0:11:38
 0:39:46
 0:13:57
 0:02:12
 0:12:02