filmov
tv
How I Use Line Charts to Spot Real Market Structure (Most Traders Overlook This)

Показать описание
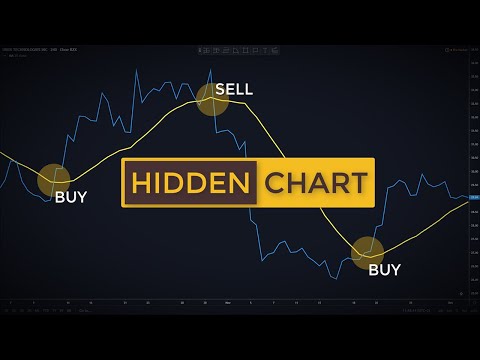
In this video, I show you how to identify real market structure using the line chart — a simple but often overlooked method that can make your entries way more accurate.
I explain the key terms (higher highs, lower lows, etc.), what to look for in a structure shift, and how the line chart exposes clean trend changes without the noise of candlestick wicks. Plus, I share my tip on using structure two timeframes above your trading chart for confluence.
Timestamps:
00:00 – Intro: What is Market Structure?
00:48 – How to Identify Uptrends vs Downtrends
01:32 – Structure Break = Momentum Shift
02:24 – Switching to Line Chart on Gold (XAUUSD)
03:29 – Confirming Structure Changes with Clean Closes
05:20 – When to Switch Back to Buying Opportunities
06:19 – Pro Tip: Identify Structure 2 Timeframes Above
07:16 – Why Line Charts Reveal Clearer Trade Zones
#MarketStructure #TradingStrategy #ForexTrading #GoldTrading #PriceAction #TechnicalAnalysis
 0:10:10
Trading Price Action Using Line Charts (Old School Forex & Stock Trading Strategies)
 0:11:18
The POWER of Line Charts Ignored By Most Traders!
 0:00:43
How To Draw The Perfect Trend Line #shorts
 0:03:05
How to build Line charts in Tableau | Tableau Charts
 0:18:01
Price Action Trading: The Power Of Line Charts Ignored By Most Traders
 0:00:48
Line chart in excel
 0:09:01
Visualise FORECASTS in your Line Charts using this SIMPLE TRICK! // Beginners Guide to Power BI 2022
 0:00:23
How to create an s-curve combo chart in #excel #exceltips #exceltricks
 1:47:38
Sierra Chart Complete Beginner Crash Course - Everything You Need To Know To Get Started
 0:07:33
#pocketoption - 2 Minute Line Chart Strategy
 0:49:46
The ultimate guide to Notion Charts (9 examples)
 0:00:30
Why You NEED To Be Using Volume When Trading
 0:00:47
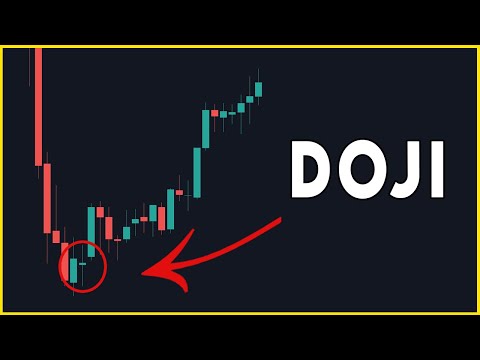
The Common MISTAKE Traders Make With Doji Candles #Shorts
 0:39:20
How to Draw Trend Lines the RIGHT Way on CANDLESTICK Charts
 0:02:49
How to create Line Chart to compare Sales of Multiple Years in PowerBI | MI Tutorials
 0:13:26
How To Scalp Higher Timeframes With A Line Chart | Forex Scalping Strategy
 0:00:26
How to Draw and Use Trendlines
 0:12:47
The Only Line Chart Trading Strategy You’ll Ever Need!
 0:55:18
How to Read Candlestick Charts (with ZERO experience)
 0:03:55
5.1 How to create Line Chart in Power BI | Power BI Tutorials for Beginners | By Pavan Lalwani
 0:00:47
How To Make a Line Graph In Excel।।Line Chart kaise use kre Excel Me।।Line Chart In Excel।। #excel...
 0:11:43
How to pick the 'perfect' chart for your situation in Power BI?
 0:00:56
The Secret To Using The Volume Profile Indicator #shorts
 0:00:41
These chart patterns will make you RICH!🤑
Комментарии