filmov
tv
How to Calculate Linear Regression SPSS

Показать описание
A visual explanation on how to calculate a regression equation using SPSS. The video explains r square, standard error of the estimate and coefficients.
David Longstreet Professor of the Universe
MyBookSucks.Com
David Longstreet Professor of the Universe
MyBookSucks.Com
 0:10:55
How To... Perform Simple Linear Regression by Hand
 0:03:55
Linear Regression in 3 Minutes
 0:02:34
Linear Regression in 2 minutes
 0:05:18
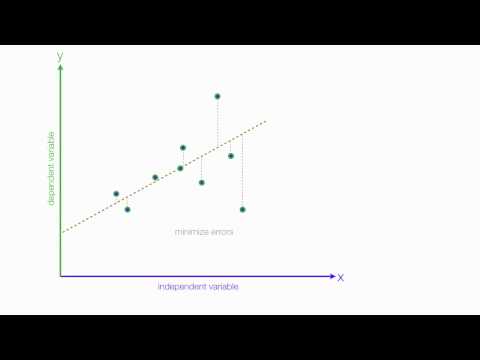
An Introduction to Linear Regression Analysis
 0:15:05
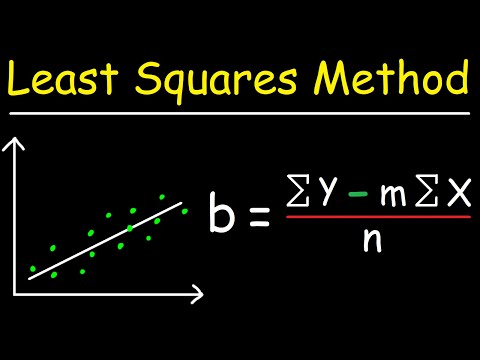
Linear Regression Using Least Squares Method - Line of Best Fit Equation
 0:13:55
Simple Linear Regression: An Easy and Clear Beginner’s Guide
 0:08:29
How to calculate linear regression using least square method
 0:07:03
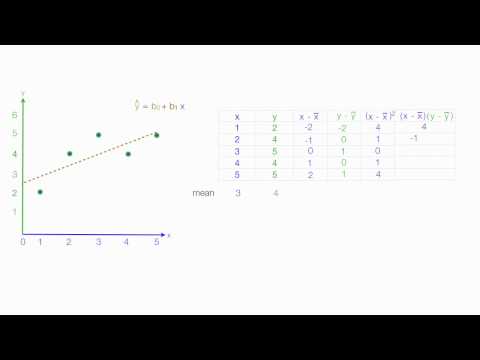
How to Calculate a Simple Linear Regression by Hand
 2:51:00
Summary session - Week 6
 0:27:27
Linear Regression, Clearly Explained!!!
 0:07:09
How to Calculate Linear Regression SPSS
 0:06:22
Finding the Regression Equation/Regression Line by Hand (Formula)
 0:01:00
Linear Regression Models #apstatistics
 0:13:29
Video 1: Introduction to Simple Linear Regression
 0:00:54
📊 Linear Regression Analysis #math #algebra #statistics
 0:20:07
Linear Regression in Statistics Explained
 0:24:58
Linear Regression and Correlation - Example
 0:06:05
Linear Regression using a calculator (Casio fx-991Ms)
 0:00:50
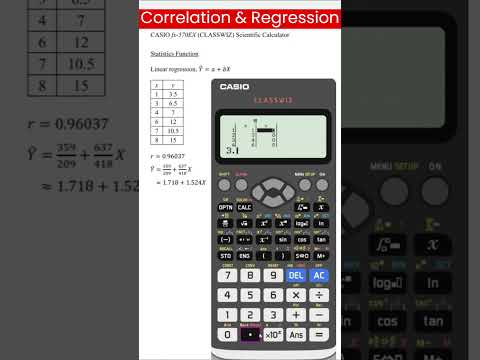
Correlation and regression for linear regression (Casio fx-570/991EX) #correlationcoefficient
 0:07:31
Regression Analysis: An Easy and Clear Beginner’s Guide
 0:05:18
How to do a linear regression on excel
 0:05:53
Excel Basics - Linear Regression - Finding Slope & Y Intercept
 0:11:01
Lec-4: Linear Regression📈 with Real life examples & Calculations | Easiest Explanation
 0:00:59
Finding the linear equation coefficients using Casio FX 991ES PLUS- #maths #physics #engineering
Комментарии