filmov
tv
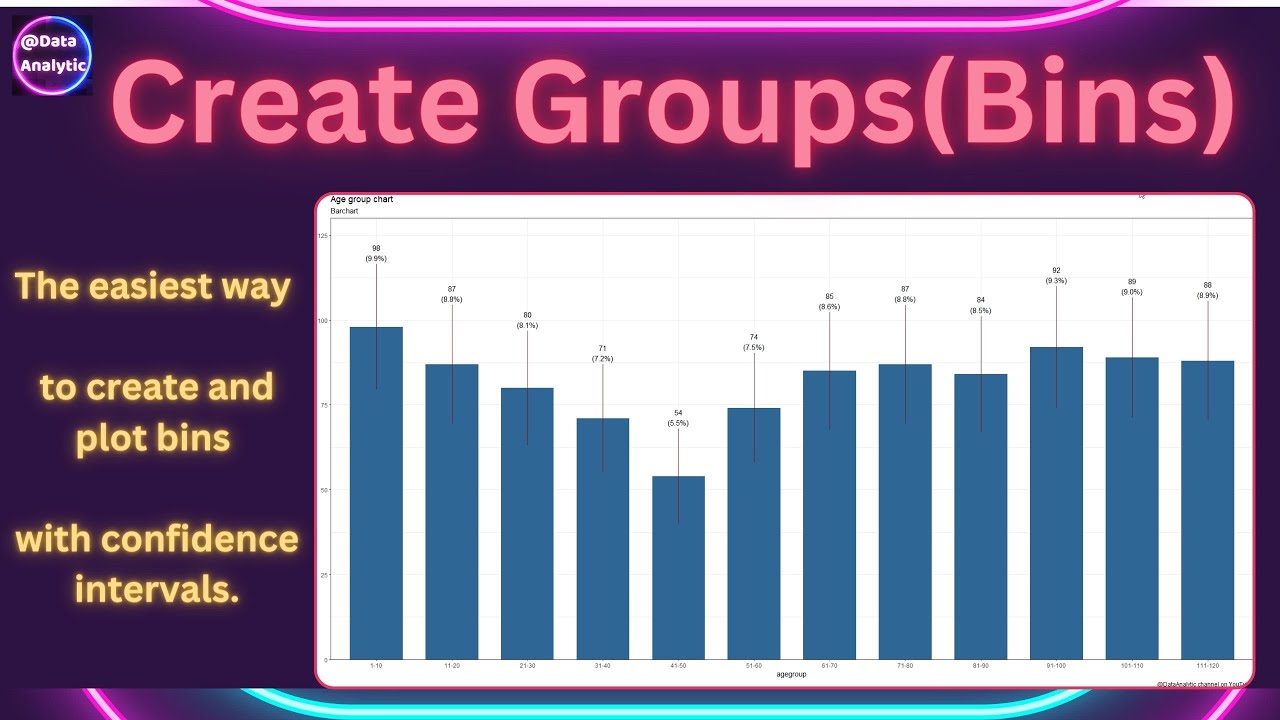
Visualizing Age Groups with sjPlot in R with confidence intervals
Показать описание
Unlock the power of sjPlot in R as we explore creating insightful visualizations for age groups. Whether you're analyzing survey data, demographic trends, or any other dataset with age-related information, this tutorial covers everything you need to know.
What You'll Discover:
Introduction to sjPlot: Get a quick overview of sjPlot and why it's a valuable tool for visualizing age groups in R.
Data Preparation: Learn how to prepare your data for age group analysis, ensuring it's structured correctly for use with sjPlot.
Age Group Categorization: Explore different methods to categorize age groups based on your data. Whether you're working with continuous or categorical age data, we've got you covered.
Creating Age Group Plots: Step-by-step guide on using sjPlot to create visually appealing and informative plots representing age groups. Customize your plots to convey the message effectively.
Interpretation and Analysis: Understand how to interpret the sjPlot age group visualizations. Extract meaningful insights and trends from your data.
Advanced Features: Dive into advanced features of sjPlot to enhance your age group visualizations. Explore options for customization, styling, and additional functionalities.
Real-world Examples: Apply your knowledge to real-world examples, demonstrating the versatility of sjPlot for age group analysis across various scenarios.
Whether you're a beginner or an experienced R user, this guide equips you with the skills to leverage sjPlot for compelling age group visualizations. Elevate your data analysis game and communicate your findings effectively with sjPlot in R."
We specialise in practical, concise and sharp videos on various data related topics like statistics, visualisation, automation, validation.
We mainly create videos on R, Python and other related technologies which compliment the data science needs.
If you are beginner then watch this video to get started
Watch our playlists
 0:08:29
 0:08:56
 0:12:20
 0:07:04
 0:33:11
 0:22:51
 0:23:52
 0:05:41
 1:48:35
 0:13:27
 0:20:48
 0:11:13
 0:09:46
 0:14:02
 0:12:31
 1:16:13
 0:18:28
 0:06:43
 0:18:14
 0:15:38
 0:14:05
 1:13:17
 0:05:29
 0:05:42