filmov
tv
R Programming Tutorial in @RStudio - 03 Plotting Data and Parametric Fitting with MATLAB/Octave & R

Показать описание
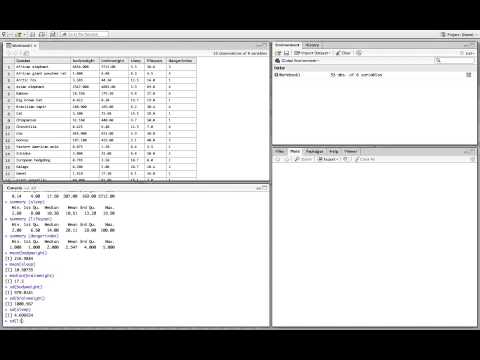
Learn how to find open/publicly available data, read CSV file into a variable, omit the NA/missing values, plot a histogram, graph a scatterplot, and find parametric fitting using polynomial regression... using both MATLAB/Octave and R (RStudio). I'm doing them side-by-side so you can see exactly how it's performed and compare them.
This is less of a R Statistics Programming Language "tutorial" and more of a learning-by-sharing video. :)
Help us caption & translate this video!
This is less of a R Statistics Programming Language "tutorial" and more of a learning-by-sharing video. :)
Help us caption & translate this video!
 0:38:56
 2:10:39
 0:06:10
 0:49:45
 0:14:13
 0:59:48
 0:10:20
 6:49:39
 1:04:48
 10:10:56
 0:03:57
 0:11:55
 1:10:56
 3:16:53
 0:08:05
 0:25:39
 0:15:49
 0:07:22
 0:00:39
 0:06:12
 0:04:31
 0:07:07
 0:22:08
 0:08:02