filmov
tv
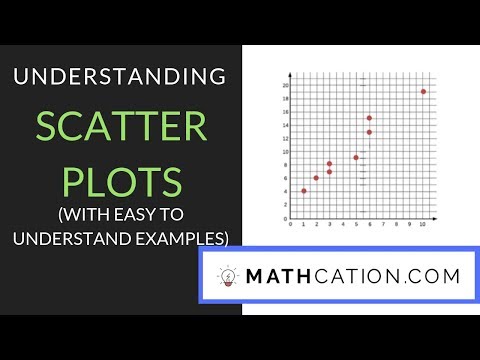
Understanding Scatter Plots 💗

Показать описание
This lesson will introduce scatter plots, how to read and interpret a scatter plot, and how to describe patterns of data trends. You will discover the types of association that may exist between two variables when comparing data. There is a positive association when x and y both increase. There is a negative association when y decreases as x increases. There may also be no association which communicates that the variables do not have a relationship.
In this video -
00:00 Introduction of Lesson & Vocabulary
00:10 Types of Relationships
00:43 Nonlinear Relationships
01:07 Student Practice #1
02:34 How to Create a Scatter Plot
03:21 How to Read & Interpret a Scatter Plot
04:35 Student Practice #2
#statistics
#scatterplots
#algebra
Investigate patterns of association in bivariate data.
Common Core Math 8.SP.A.1
Construct and interpret scatter plots for bivariate measurement data to investigate patterns of association between two quantities. Describe patterns such as clustering, outliers, positive or negative association, linear association, and nonlinear association.
 0:05:46
 0:04:51
 0:01:04
 0:14:56
 0:02:52
 0:02:37
 0:06:03
 0:01:48
 2:03:01
 0:02:31
 0:07:11
 0:01:54
 0:04:23
 0:07:09
 0:03:13
 0:06:47
 0:19:54
 0:03:31
 0:04:35
 0:19:14
 0:05:32
 0:06:33
 0:08:25
 0:00:34