filmov
tv
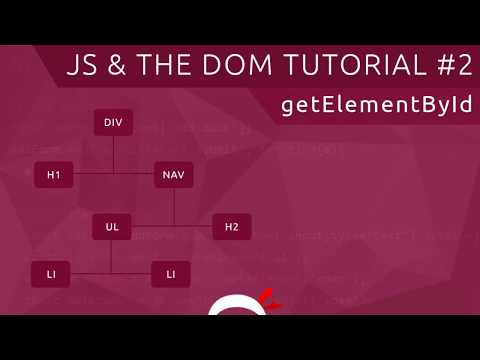
How to get element by id in javascript | JavaScript Tutorial

Показать описание
How to get element by id in javascript | JavaScript Tutorial
But extracting the value of the ID itself will depend with different cases. If you work with a basic tag such as an div, paragraph or list you will use different commands and use the innerText to extract and display the text.
If you have input types of any kind you will be using the ".value" command together with the getElementById. The most important part is to know how to extract the text or value with the right codes. We will be covering both cases and eventually display it in a new class with the querySelector command. This will be fun and interesting!
Got a question or special request about a specific item in javascript? Comment below and tell me your question. I will make sure to follow up on you!
Interested to learn about how to create charts? Check out below!
⭐ Chart JS Udemy Course ⭐:
Chart JS tutorials for Beginners:
Chart JS tutorials for Intermediate:
Chart JS Dashboard Series:
👍 Most Liked Video Series:
Why did I created these Chart JS video tutorials?
Have you ever used Excel where charts appear almost magically with a click on a button. You notice if you look at a chart or graph you can absorb information within seconds which would take you minutes if it is a table with data.
"A picture is worth a thousand words"
We all know that pictures and colors spark the mind. However, if you try to draw or code a 📊 bar chart or a 📈 line chart, or any type of chart in a Javascript library it is a big challenge. The documentation makes it hard and the it is very hard to work with a canvas tag.
Ancient Egypt used hieroglyphs in their writing system. Which was both logical and creative at the same time. And this is why I love charts as well. A chart is the closes to translating logic into visuals. Making the chart interactive is the best way to communicate your message to others.
If we know about this why is coding charts so complicated?
Because computer programming language is based on 100% logic. This is why when you look at Chart.JS, D3.JS, Chartist and other chart libraries in JS you will need to basically explain in logic to a computer what to make visual.
How and where can I help?
My goal and focus is on creating easy to understand Chart.JS videos so you can start using Chart JS in all your website endeavors making Chart.JS a topnotch and leading JS library for the years to come. Just like any programming library once more people use Chart JS it will attract more people to contribute and grow. The videos on Youtube and my complete course on Udemy are here to give a helping hand.
Seeing Chart.JS evolve from Chart.JS 1.0 to Chart.JS 3.0 and with their currently new expansion to Chart.JS 3.0 we can expect more new exciting charts in the near future.
About Chart.JS 3 | Chart JS 3
Chart JS is one of the most use Javascript libraries for the drawing charts. It is designed to create charts in the canvas tag which is great but at the same time slightly challenging for most people. However, knowing how to draw a chart will give you a big edge and most dashboards are consistently adding charts along data tables. Chart JS makes your data more alive and visually more appealing.
What type of charts can you make with Chart.JS?
With chart js you can make line chart, bar chart, pie chart, doughnut chart, scatter chart, polar area chart, radar chart, gauge chart and area chart. And with some clever tricks and visual adjustment more can be done.
 0:07:24
Element Explained and 6 Ways to Farm it | Ark: Survival Evolved | SH Ep. 20
 0:02:25
How to Farm Element on Fjordur ► Ark Fjordur
 0:05:03
JavaScript DOM Tutorial #2 - Get Element By ID
 0:05:47
HOW TO GET FAST ELEMENT SOLO | THE ISLAND | ARK OFFICIAL PVP PS4
 0:11:03
How to Get Element on Ark Aberration (Element Farming Guide)
 0:01:09
Element ARK Spawn COMMAND | How To Summon ELEMENT Ark CODE 2023
 0:11:13
What Is Your Soul Element? Cool Personality Test
 0:17:19
ARK Genesis 2 Best Way to Get ELEMENT!
 0:00:24
Did you know #4 - Get a Random Element from an Array #javascript #coding #didyouknow
 0:03:29
How to get the element position on the screen with JavaScript (X and Y coordinates)
 0:04:23
How to find the Protons Neutrons and Electrons of an element on the Periodic table
 0:14:06
Get Your Page Element Locator (XPath/CSS) In Just One Click Without Using ChromeDevTools/HTML DOM
 0:04:48
Ark Tutorial: How to get element dust for beginners!!
 0:15:00
ARK Crystal Isles How to make Element SeeShellGaming
 0:11:33
The NEW Best Element Locations on Ark Fjordur - The Easiest Safest Element on the Fjordur Map
 0:22:20
How to Get and Use Element Gachas - What the Alphas Don't Want You to Know | ARK: Survival Evol...
 0:05:26
CRYSTAL ISLES ELEMENT HARVESTING!!! HOW TO GET LOADS OF ELEMENT FAST!
 0:10:20
COMPLETE ELEMENT Guide | How to get Element on FJORDUR
 0:01:08
Get ID of Clicked Element using JavaScript
 0:08:00
How to craft unlimited element on Ark Mobile SP, Official, Unoffcial| with AsianRom3o
 0:07:23
How to Write the Electron Configuration for an Element in Each Block
 0:05:50
Selenium Python Tutorial #15 - How to Find Element By XPath
 0:16:33
HTML Element Selectors In JavaScript | JavaScript Tutorial In Hindi #14
 0:00:21
How to remove the paywall on enotes using inspect element
Комментарии