filmov
tv
GIS Viewer User Tutorial

Показать описание
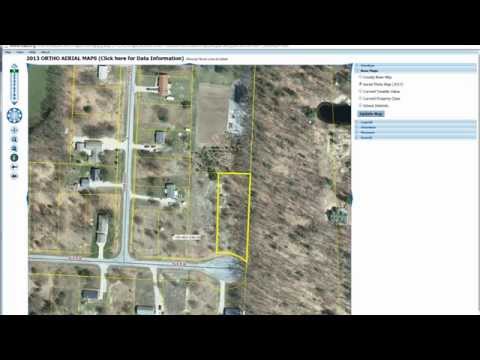
Large scale geospatial simulations, at the municipal, provincial, or higher levels, typically generate massive volumes of data. Presenting these data in a comprehensive, intuitive way for non-expert users requires adequate visual support. In the case of geospatial data, web-based geographic information systems (GIS) have become well-established platforms to do so. The DEVS-GIS Simulation Explorer we developed relies on OpenLayers, one of the more established Open Source Web GIS libraries, and the OpenStreetMap database to contextualize simulation results. As a case study, we use the results of the disease spread simulation model, for the City of Ottawa at the Dissemination Area (DA) level and for the province of Ontario at the Census Subdivision (CSD) level. The application allows users to build choropleth maps that display the boundary polygons classified by color according to different variables produced by the simulation (infected, susceptible, deaths, recovered, etc.) Users can also animate the map to visualize each time step of the simulation and interact with individual geometries to explore the detailed results of the simulation.
 0:03:55
 0:04:23
 0:08:03
 0:15:12
 0:00:20
 0:08:06
 0:51:43
 0:08:03
 0:23:07
 0:00:59
 0:56:18
 0:17:32
 0:03:30
 0:05:22
 1:00:57
 0:00:17
 0:01:00
 1:12:46
 0:09:24
 0:00:24
 0:00:26
 0:01:29
 0:24:51
 0:31:58