filmov
tv
Linear Regression Tutorial | Simple Linear Regression | Python Machine Learning Tutorial Part 1

Показать описание
Linear Regression Tutorial | Simple Linear Regression | Machine Learning Algorithms in Python Part 1
Hello and welcome to Machine learning tutorial powered by Acadgild. In this tutorial, you will be to learn about the Linear Regression which models one of the simplest kind of relationships between variables.
What is Regression Analysis?
• Regression Analysis Investigates the relationship between dependent and independent variables
• Used for forecasting, time series modeling and finding causal relationships between variables.
• Determines significant relationships between independent and dependent variables
• Determines the strength of the impact of multiple independent variables on dependent variables
• Allows to find relationships between variables measured at different scales.
What is Simple Linear Regression?
It is the model that describes
• For finding relationships between two variables
• The relationship is not deterministic, but static
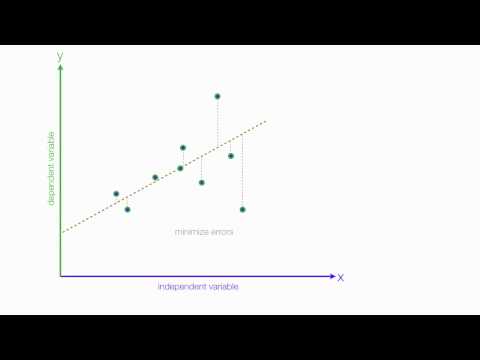
• The idea is to find the line that best fits the data
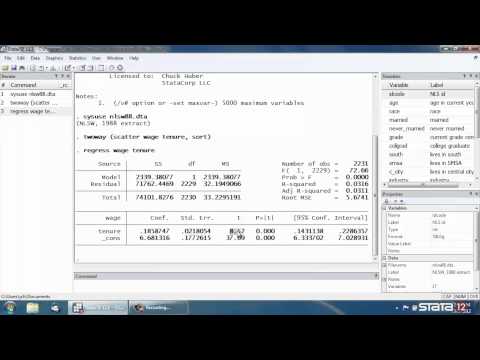
• The relationship expressed as y=B0+B1*x+e, which is the regression model
What is Multiple Linear Regression?
• Uses several explanatory variables to predict the outcome of the response variable
• Model is given as: y = B0+B1xi1+B2xi2+….+ Bpxip+E where I = 1,2,…, n
• The line gives how the mean response μy changes with the explanatory variables
• Data = Fit + Residual
• Residual is the deviations of observations from their means.
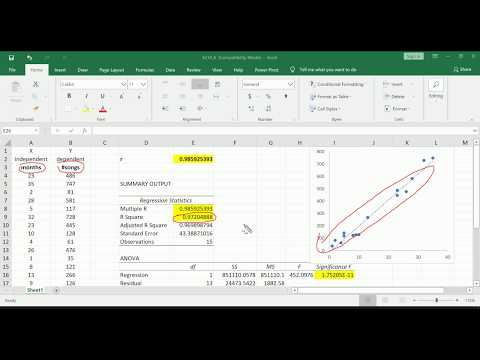
Lease Square Method:
• Used to minimize the residual.
• The best fitting line is calculated by minimizing the sum of the squares of the vertical deviations from each data point on the line.
Algorithm Advantages:
• Very easy and intuitive to use and understand
• When relationships between the independent variables and the dependent variable are almost linear, shows optimal results
• Even when it doesn’t fit the data exactly, we can use it to find the nature of the relationship between the two variables.
Disadvantages of Linear Regression:
• Limited to Linear relationships
• Very sensitive to anomalies in the data (or Outliers)
• If we have a number of parameters greatest than the number of samples available, then the model starts to model the noise rather than the relationship between the variables.
Assumptions of Linear Regression:
• Linear relationship
• Multivariate normality
• No or little multicollinearity
• No auto-correlation
• Homoscedasticity
In the next video, we will look at the implementation of simple linear regression and multiple linear regression in Python. Please subscribe and stay tuned for more such videos.
#machinelearningtutorial, #linearRegression #MachineLearning, #Simplelinearregression, #linear, #regression
For more updates on courses and tips follow us on:
Hello and welcome to Machine learning tutorial powered by Acadgild. In this tutorial, you will be to learn about the Linear Regression which models one of the simplest kind of relationships between variables.
What is Regression Analysis?
• Regression Analysis Investigates the relationship between dependent and independent variables
• Used for forecasting, time series modeling and finding causal relationships between variables.
• Determines significant relationships between independent and dependent variables
• Determines the strength of the impact of multiple independent variables on dependent variables
• Allows to find relationships between variables measured at different scales.
What is Simple Linear Regression?
It is the model that describes
• For finding relationships between two variables
• The relationship is not deterministic, but static
• The idea is to find the line that best fits the data
• The relationship expressed as y=B0+B1*x+e, which is the regression model
What is Multiple Linear Regression?
• Uses several explanatory variables to predict the outcome of the response variable
• Model is given as: y = B0+B1xi1+B2xi2+….+ Bpxip+E where I = 1,2,…, n
• The line gives how the mean response μy changes with the explanatory variables
• Data = Fit + Residual
• Residual is the deviations of observations from their means.
Lease Square Method:
• Used to minimize the residual.
• The best fitting line is calculated by minimizing the sum of the squares of the vertical deviations from each data point on the line.
Algorithm Advantages:
• Very easy and intuitive to use and understand
• When relationships between the independent variables and the dependent variable are almost linear, shows optimal results
• Even when it doesn’t fit the data exactly, we can use it to find the nature of the relationship between the two variables.
Disadvantages of Linear Regression:
• Limited to Linear relationships
• Very sensitive to anomalies in the data (or Outliers)
• If we have a number of parameters greatest than the number of samples available, then the model starts to model the noise rather than the relationship between the variables.
Assumptions of Linear Regression:
• Linear relationship
• Multivariate normality
• No or little multicollinearity
• No auto-correlation
• Homoscedasticity
In the next video, we will look at the implementation of simple linear regression and multiple linear regression in Python. Please subscribe and stay tuned for more such videos.
#machinelearningtutorial, #linearRegression #MachineLearning, #Simplelinearregression, #linear, #regression
For more updates on courses and tips follow us on:
 0:02:34
Linear Regression in 2 minutes
 0:10:55
How To... Perform Simple Linear Regression by Hand
 0:13:29
Video 1: Introduction to Simple Linear Regression
 0:50:52
Linear Regression in Python - Full Project for Beginners
 0:04:42
What is linear regression?
 0:35:46
Linear Regression Analysis | Linear Regression in Python | Machine Learning Algorithms | Simplilearn
 0:17:46
Machine Learning in Python: Building a Linear Regression Model
 0:15:14
Machine Learning Tutorial Python - 2: Linear Regression Single Variable
 0:21:58
Deep Learning with PyTorch - Linear Regression model from scratch
 0:27:27
Linear Regression, Clearly Explained!!!
 0:05:18
How to do a linear regression on excel
 0:24:38
Linear Regression From Scratch in Python (Mathematical)
 0:05:18
An Introduction to Linear Regression Analysis
 0:10:34
Simple Linear Regression Analysis For Beginners | Basic Predictive Analytics
 0:12:48
Simple Linear Regression in Python - sklearn
 0:05:30
Linear Regression Algorithm – Solved Numerical Example in Machine Learning by Mahesh Huddar
 0:14:51
How To Perform Simple Linear Regression In Excel
 0:05:38
Simple Linear Regression in R | R Tutorial 5.1 | MarinStatsLectures
 0:45:17
Regression Analysis | Full Course
 0:45:33
Simple Linear Regression: Basic Concepts Part I
 0:14:56
Simple Linear Regression Example
 0:13:46
Linear Regression Model Techniques with Python, NumPy, pandas and Seaborn
 0:05:15
Simple linear regression in Stata®
 0:28:36
Linear Regression Algorithm | Linear Regression in Python | Machine Learning Algorithm | Edureka
Комментарии