filmov
tv
Tableau Tip: How to build GAUGE Chart
Показать описание
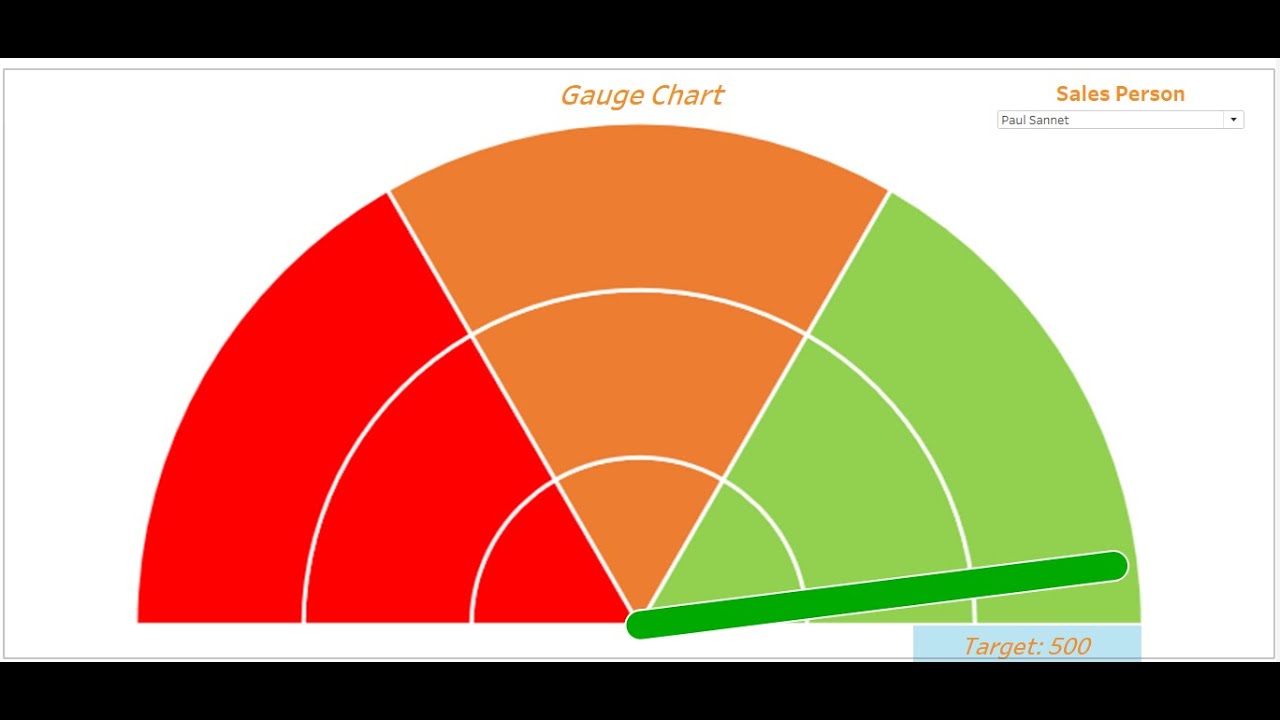
Tableau Tip: How to build GAUGE Chart
I would like to share you the way to build GAUGE chart using mathematical formulas.
X: 1+sqrt(2)*COS((1-sales%)*PI())
Y: 1+sqrt(2)*SIN(sales%)*PI()
This can be applied for KPI tracking or speed odometer.
I hope you enjoy it. Have a good day.
I would like to share you the way to build GAUGE chart using mathematical formulas.
X: 1+sqrt(2)*COS((1-sales%)*PI())
Y: 1+sqrt(2)*SIN(sales%)*PI()
This can be applied for KPI tracking or speed odometer.
I hope you enjoy it. Have a good day.
 0:11:31
Make an AWESOME Tableau Dashboard in Only 10 Minutes
 0:12:54
Tableau Tutorial for Beginners | Create Your First Dashboard
 0:13:57
Tableau Dashboard Tips [Top 10 Tableau Dashboard Design Tips]
 0:23:03
Tableau Basics for Beginners - Tableau in Two Minutes
 0:04:50
Top 6 tips for building your Tableau Conference schedule
 0:16:28
Build the ULTIMATE Tableau Dashboard from Scratch
 0:26:00
Tips and Tricks to Build Dashboards with Tableau | Tableau Training | Edureka | Tableau Live - 2
 0:12:05
10 Tableau tricks you should know | Tableau Tips and Tricks | sqlbelle
 0:55:25
Day 1: Tableau Tip Battle Week - Formatting Tips
 0:00:52
How I Use TABLEAU as a DATA ANALYST
 0:15:40
How to Build Summary Tiles for Tableau Dashboards
 0:11:33
Tableau Layout Containers Tips, Tricks and Uses
 0:00:54
#Tableau Tip - Create Group based on #Substring #tableautips #tableaututorial #tableaudesktop
 0:47:05
Tableau tips for beginners
 0:11:16
12 Top Tips to Improve Tableau Performance (DataSource)
 0:11:52
Enhance your Tables in Tableau [A Step by Step Guide]
 0:18:45
Tableau Dashboards | 7 Practical Tips and Tricks | Tiled, Floating, Containers, Formatting, Colors
 0:20:07
Top 20 Tableau Tips and Tricks in 20 Minutes | Tableau Tutorial | Tableau Training | Edureka
 0:11:35
Tableau Layout Containers Explained in Under 10 mins : 2020 Updated
 0:11:56
10 more Tableau tips and tricks you should know | sqlbelle
 0:10:55
How to do multi-line calculations and edits for Tableau: Quick Tip
 0:07:05
How to build Maps in Tableau | Tableau Charts
 0:51:54
Tableau Tips for Beginners
 0:26:41
Tableau Speed Tips | Tricks for All Skill Levels
Комментарии