filmov
tv
Intro to Intel Performance Tools
Показать описание
This seminar will takes introductory look at how to load and use the additional performance development tools provided by the Intel Parallel Studio XE 2018 Cluster Edition available on the Graham compute cluster.
When used as part your HPC daily workflow, these tools can greatly improve code development optimization outcomes and the time required to perform this work, ultimately reducing code execution runtimes when used in conjunction with the Intel compilers and MKL, IPP, TBB, DAAL, MPI performance libraries. The tools introduced are:
Intel Advisor – Optimize Vectorization and Thread Prototyping for C, C++, Fortran
Intel Inspector – Easy-to-use Memory and Threading Error Debugger for C, C++, Fortran
Intel Vtune Amplifier – Serial/Threaded Performance Profiler for C, C++, Fortran, Mixed Python
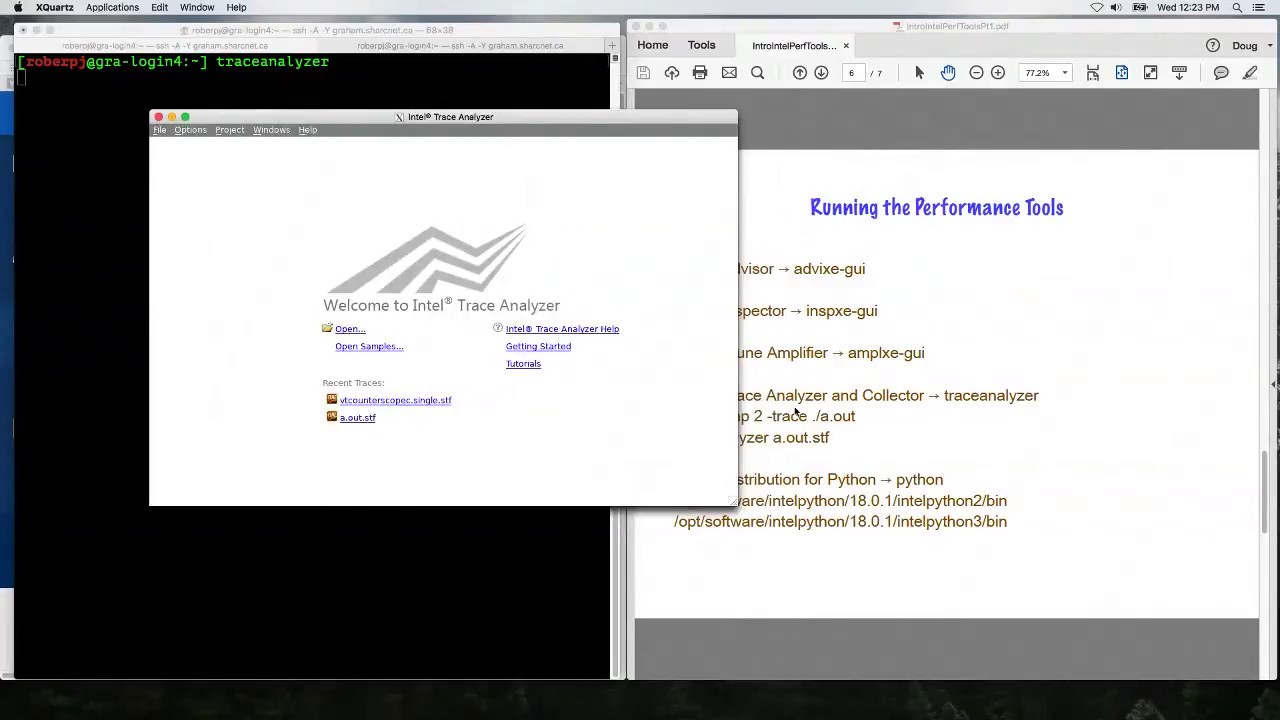
Intel Trace Analyzer and Collector – Understand MPI application behavior for C, C++, Fortran, OpenSHMEM
Intel Distribution for Python – High-performance Python powered by native Intel Performance Libraries
_________________________________________________
When used as part your HPC daily workflow, these tools can greatly improve code development optimization outcomes and the time required to perform this work, ultimately reducing code execution runtimes when used in conjunction with the Intel compilers and MKL, IPP, TBB, DAAL, MPI performance libraries. The tools introduced are:
Intel Advisor – Optimize Vectorization and Thread Prototyping for C, C++, Fortran
Intel Inspector – Easy-to-use Memory and Threading Error Debugger for C, C++, Fortran
Intel Vtune Amplifier – Serial/Threaded Performance Profiler for C, C++, Fortran, Mixed Python
Intel Trace Analyzer and Collector – Understand MPI application behavior for C, C++, Fortran, OpenSHMEM
Intel Distribution for Python – High-performance Python powered by native Intel Performance Libraries
_________________________________________________
 0:13:28
 0:06:45
 0:03:02
 0:03:49
 0:02:31
 0:04:31
 0:00:59
 0:05:53
 0:14:56
 1:02:27
 0:01:37
 0:02:55
 0:01:10
 0:05:48
 0:09:05
 0:01:48
 0:01:37
 0:02:31
 0:28:55
 0:01:00
 0:00:58
 0:22:43
 0:05:07
 0:03:57