filmov
tv
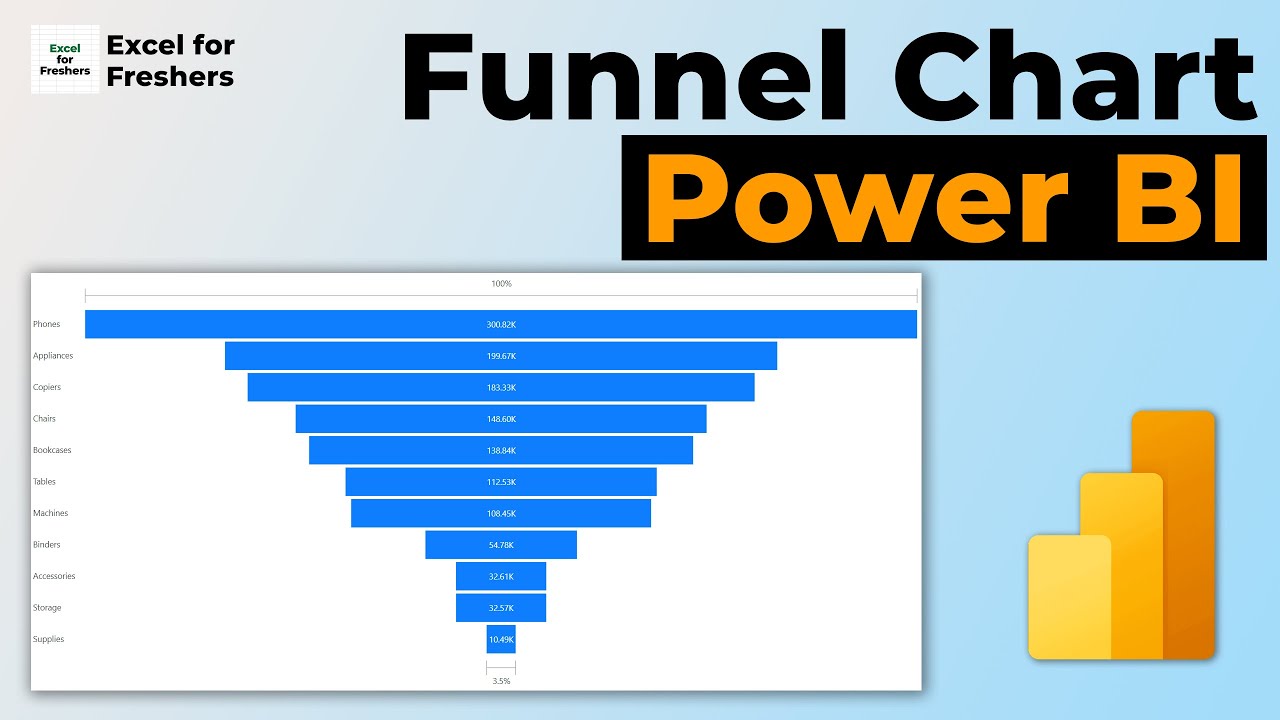
Create a Funnel Chart in Power BI | Power BI
Показать описание
About Video - In this Power Bi tutorial we learn how to apply conditional formatting in power bi. This is power bi tutorial for beginners. Here I request you to please subscribe our channel in future videos we will learn about how we create Power Bi dashboard, Power Bi dashboard design and Power Bi project. We cover all tutorials of Power Bi in Hindi. If you want to become Power Bi developer, you can start your journey from here.
Welcome to our Power BI tutorial, where we're about to embark on a journey of creating dynamic and visually engaging Funnel Charts! Whether you're aiming to track sales processes, analyze conversion rates, or visualize any step-by-step progression, Funnel Charts in Power BI are the perfect tool for the job. In this comprehensive guide, we'll walk you through the step-by-step process, ensuring that Funnel Charts not only become a part of your toolkit but a creative way to tell your data story. Let's dive in!
You'll learn
➟ How to Create a Funnel Chart in Power BI
➟ How to Customize a Funnel Chart in Power BI
👋 Additional resources
Hit the Subscribe button to stay tuned for more Power BI tutorials and data visualization tips!
Get ready to funnel your data into a compelling narrative with Funnel Charts in Power BI. Whether you're presenting to stakeholders or refining your analytics, mastering this visualization technique will undoubtedly enhance your data storytelling capabilities. Let's make your data journey more exciting! 💻✨
#vinaysolanki #excelforfreshers #powerbi #PowerBI #DataVizTutorial #FunnelCharts #DataStorytelling #VisualizeWithImpact
 0:06:26
 0:04:24
 0:11:06
 0:02:21
 0:03:55
![[TABLEAU] How to](https://i.ytimg.com/vi/msDySeR1z6I/hqdefault.jpg) 0:03:27
0:03:27
 0:07:26
 0:09:24
 1:03:03
 0:08:51
 0:02:37
 0:04:36
 0:05:43
 0:13:19
 0:05:32
 0:07:53
 0:07:31
 0:02:16
 0:03:01
 0:14:04
 0:08:02
 0:01:09
 0:14:11
 0:01:29