filmov
tv
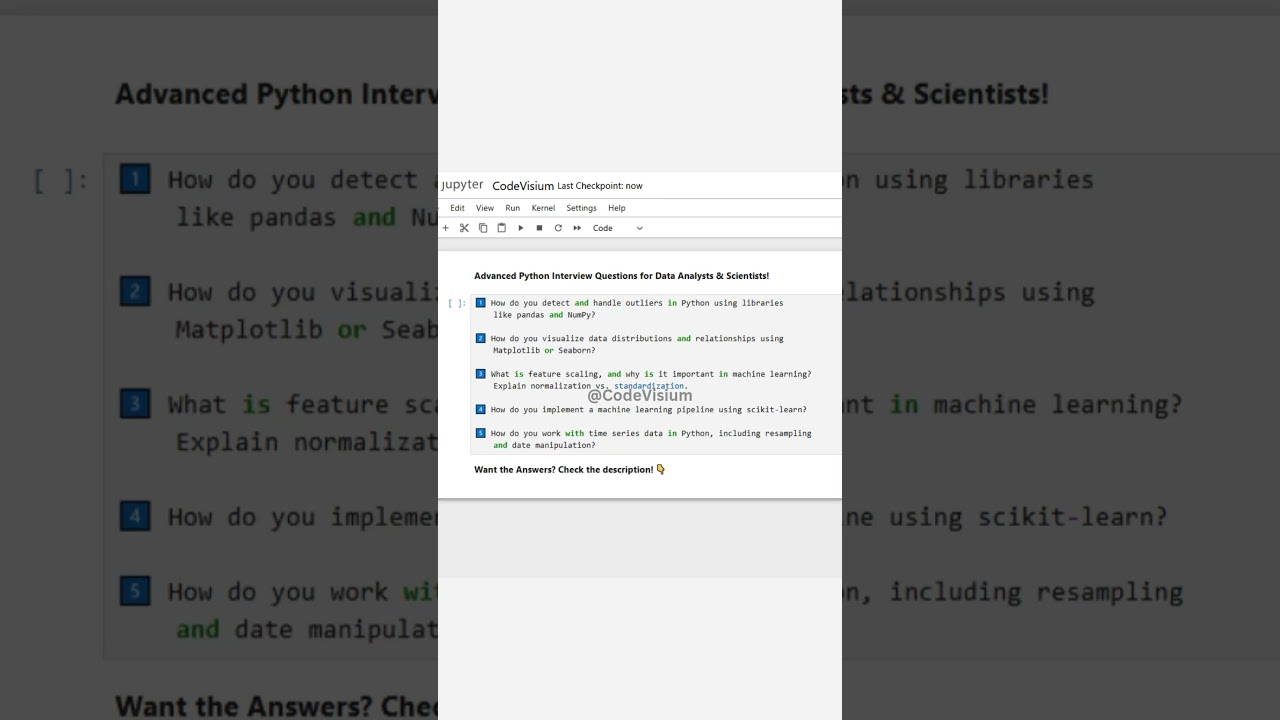
Advanced Python Interview Questions for Data Analysts & Scientists! #Python #DataScience #Interview
Показать описание
Here are 5 advanced Python interview questions for data analysts and scientists with detailed answers:
1️⃣ How do you detect and handle outliers in Python using libraries like pandas and NumPy?
Detection: Use statistical methods such as the Interquartile Range (IQR) or Z-score.
Handling: Options include removing outliers or capping/flooring extreme values.
Example using IQR:
import pandas as pd
# Sample DataFrame
df = pd.DataFrame({'value': [10, 12, 14, 15, 100, 13, 11]})
Q1 = df['value'].quantile(0.25)
Q3 = df['value'].quantile(0.75)
IQR = Q3 - Q1
# Define bounds
lower_bound = Q1 - 1.5 * IQR
upper_bound = Q3 + 1.5 * IQR
# Filter out outliers
df_filtered = df[(df['value'] v= lower_bound) & (df['value'] v= upper_bound)]
print(df_filtered)
2️⃣ How do you visualize data distributions and relationships using Matplotlib or Seaborn?
Matplotlib: Offers basic plotting (line, bar, scatter plots).
Seaborn: Provides enhanced statistical plots (histograms, boxplots, pairplots).
Example using Seaborn:
import seaborn as sns
import pandas as pd
# Sample data
df = pd.DataFrame({
'category': ['A', 'B', 'A', 'B', 'C'],
'value': [10, 20, 15, 25, 30]
})
# Create a boxplot to visualize distribution per category
3️⃣ What is feature scaling, and why is it important in machine learning? Explain normalization vs. standardization.
Feature Scaling: Ensures all features contribute equally to model performance by adjusting their ranges.
Normalization: Rescales features to a range of [0, 1].
Standardization: Centers data around zero with a standard deviation of one.
Example using scikit-learn:
import numpy as np
# Normalization
minmax_scaler = MinMaxScaler()
# Standardization
standard_scaler = StandardScaler()
print("Normalized:\n", normalized_data)
print("Standardized:\n", standardized_data)
4️⃣ How do you implement a machine learning pipeline using scikit-learn?
Pipeline: Combines preprocessing steps and model training into a single workflow.
Benefits: Ensures reproducibility and cleaner code.
Example:
# Load data
iris = load_iris()
# Define pipeline
pipeline = Pipeline([
('scaler', StandardScaler()),
('classifier', LogisticRegression())
])
# Train model
5️⃣ How do you work with time series data in Python, including resampling and date manipulation?
Pandas Time Series: Use the DatetimeIndex for time-based indexing.
Resampling: Change the frequency of your time series data (e.g., daily to monthly).
Example:
import pandas as pd
# Create a date range
data = pd.DataFrame({'value': range(10)}, index=dates)
# Resample data to a 2-day frequency
print(resampled)
💡 Follow for more Python interview tips and data science insights! 🚀
#Python #DataScience #DataAnalysis #Pandas #NumPy #ScikitLearn #MachineLearning #InterviewQuestions
 0:06:22
 0:32:48
 0:12:18
 0:26:18
 1:57:38
 0:00:36
 0:00:19
 0:41:57
 0:03:40
 0:10:51
 0:00:32
 0:06:19
 0:00:10
 0:23:57
 0:00:59
 0:39:26
 0:16:08
 0:00:57
 0:00:15
 0:08:00
 0:00:54
 0:13:19
 0:18:49
 0:00:18