filmov
tv
#Kubernetes tutorial for beginners | K8s Monitoring and troubleshooting | Deploy Prometheus Grafana

Показать описание
#Kubernetes tutorial for beginners | Kubernetes Monitoring and troubleshooting | Deploy Prometheus and Grafana
kubernetes monitoring, kubernetes monitoring prometheus grafana, grafana kubernetes monitoring, kubernetes monitoring prometheus-grafana, prometheus operator kubernetes
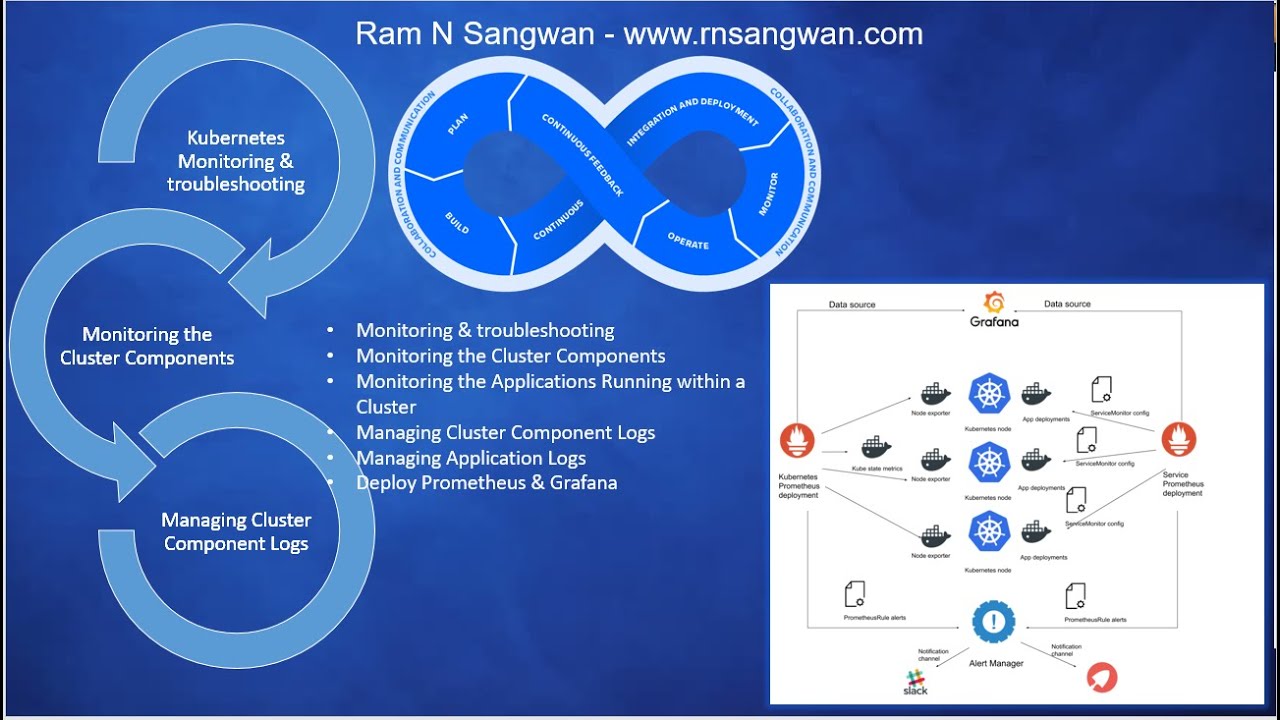
Monitoring the Cluster Components
Monitoring the Applications Running within a Cluster
Managing Cluster Component Logs
Managing Application Logs
Deploy Prometheus & Grafana
Run kubectl describe pod pod and kubectl get pods.
Check the pod's status. CrashLoopBackOff means that the pod runs a container that immediately exits. This is commonly caused by a misconfiguration or invalid image. ErrImagePull means that the image could not be retrieved from the image repository. Check that the node has network access to the repository.
Your pod can be configured with imagePullSecrets that provide authentication when it needs to access the registry. Make sure you understand and are using the correct service type - the default is clusterIP, where the service is only exposed inside the cluster. Use kubectl exec -it pod sh to get a shell in a pod inside the cluster, then try to curl one of the pod's directly. kubectl get pods -o wide gets you the IP address of all the pods in the cluster.
Then try to curl the service.
This helps you diagnose if the pod is misconfigured or if the service is misconfigured. Real-world monitoring goes far beyond checking whether a system is up and running. Operation teams can best serve the business when they can anticipate the issues and mitigate them before a system goes offline.
Best practices in monitoring are to measure the performance and usage of core resources and watch for trends that stray from the normal baseline.
Containers are not different here, and a key component to managing our Kubernetes cluster is having a clear view into performance and availability of the OS, network, system CPU and memory, and storage resources across all nodes. If our nodes were already running a number of monitoring services, we can see these by running the get pods command with the kube-system namespace:
# kubectl get pods --namespace=kube-system
Monitoring needs to be set up at the container, pod, service, node, and cluster level. Heapster is a widely used tool for monitoring performance and resource usage of the cluster. If Heapster is running, the command kubectl top pod outputs resource usage for pods in the cluster. cAdvisor is an open source project from Google, which provides various metrics on container resource use. Metrics include CPU, memory, and network statistics.
 3:36:55
 1:12:04
 0:02:07
 0:06:28
 0:17:47
 1:01:19
 0:29:34
 0:14:13
 1:24:24
 2:58:01
 2:19:32
 1:41:58
 2:10:00
 0:15:18
 6:14:41
 1:05:15
 0:13:01
 0:15:05
 1:52:15
 0:06:24
 0:04:42
 5:56:37
 3:11:16
 0:10:59