filmov
tv
Illustrating the Central Limit Theorem Using Python and Numpy

Показать описание
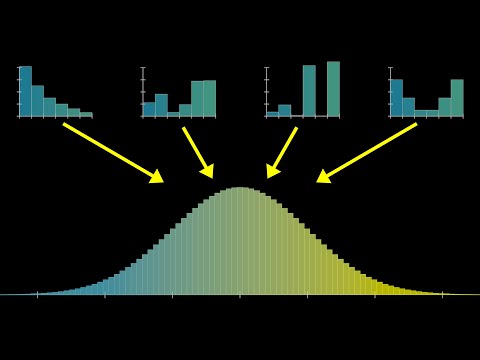
Using numpy we generate a population distribution with non-normal characteristics (gamma family). Then by way of the random module, we take a series of samples from that distribution, computing their average each time, then plot the distribution of the averages.
The result is that the distribution of the averages is normally distributed. We then observe the mean of the normally distributed averages, is the same as the mean of the Gamma population distribution.
The upshot is that you can leverage known traits of the normal distribution now to make observations about the parent distribution.
 0:07:35
The Central Limit Theorem, Clearly Explained!!!
 0:31:15
But what is the Central Limit Theorem?
 0:07:27
Real-world application of the Central Limit Theorem (CLT)
 0:00:46
Central Limit Theorem animation
 1:01:09
Central Limit Theorem - Sampling Distribution of Sample Means - Stats & Probability
 0:06:39
The Central Limit Theorem - understanding what it is and why it works
 0:07:51
Illustrating the Central Limit Theorem
 0:08:11
Introduction to the New Statistics - 4.3 Central limit theorem
 0:03:11
Python Tutorial: Central limit theorem
 0:13:14
Introduction to the Central Limit Theorem
 0:01:46
Illustrating the central limit theorem
 0:04:03
Illustration of Central Limit Theorem
 0:11:25
Using the Central Limit Theorem
 0:04:44
STATISTICS- What is Central Limit Theorem?
 0:20:19
Illustrate the Central Limit Theorem
 0:03:22
Animation Illustration for Central Limit Theorem
 0:31:03
CENTRAL LIMIT THEOREM || STATISTICS AND PROBABILITY Q3
 0:08:54
Understanding the Central Limit Theorem using SPSS and Excel
 0:21:32
A Central Limit Theorem For Graphs
 0:04:08
Illustration of Central Limit Theorem in Excel
 0:28:15
Intro to Statistics: Normal Distribution & Central Limit Theorem | Tutorial 2 | MarinStatsLectur...
 0:04:25
Central Limit Theorem Explained in Hindi | Statistics Series
 0:55:13
Central Limit Theorem and Examples
 0:10:53
Probability, Distributions, and the Central Limit Theorem (updated)
Комментарии