filmov
tv
How to Visualize Data in Postman
Показать описание
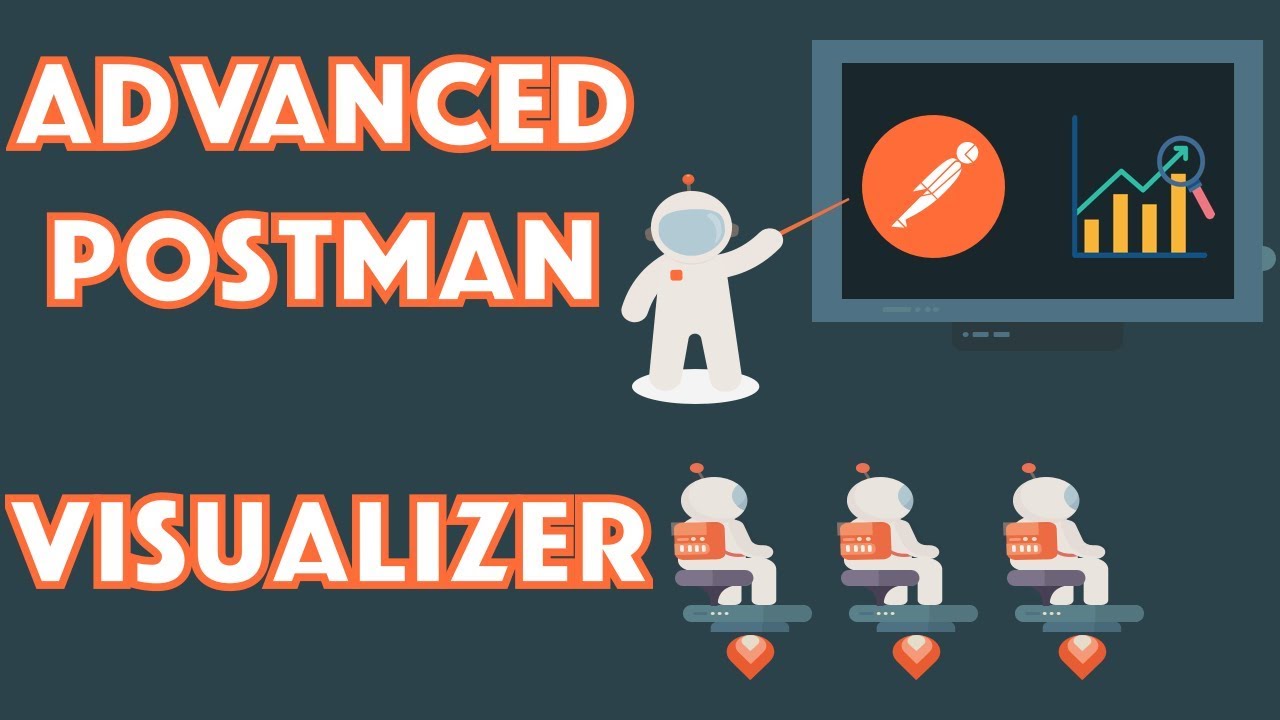
Welcome to Advanced Postman!
This episode covers Postman Visualizer, a powerful, built in, HTML, CSS, and Javascript renderer.
Watch the first series, Introduction to Postman here!
Watch the first episode of Advanced Postman - Version Control
Watch the second episode of Advanced Postman - Mock Server
Watch the third episode of Advanced Postman - Monitors
Watch the fourth episode of Advanced Postman - Newman
Watch the fifth episode of Advanced Postman - Postman API
Watch the sixth episode of Advanced Postman - XML Scripting
Watch the seventh episode of Advanced Postman - Create APIs
Download:
Postman Docs and Visualizer Examples:
Postman Echo Docs:
More Resources:
Postman Documenter and Collection Export - Visualizer Line Graph - Financial
World Trading Data
HTML Template:
Questions about this episode or Postman? Ask in the comments!
 0:27:21
Data Visualization Tutorial For Beginners | Big Data Analytics Tutorial | Simplilearn
 0:21:15
How to Visualize Data (Part 1)
 0:17:04
How to Install Tableau and Create First Visualization | Tableau Tutorials for Beginners
 0:04:21
3 Ways to Visualize Data in ArcGIS Insights in 3 Minutes
 0:07:48
The Art of Data Visualization | Off Book | PBS Digital Studios
 0:04:39
How to visualize data in Microsoft Word.
 0:13:12
Data Analytics - How To Visualize Complex Data
 0:03:05
How to Visualize Data in Power BI
 0:00:28
Quick Sum All Data in Excel #excel #excellifehacks #microsoftexcel #productivityhacks #excellife
 0:23:03
Power BI Tutorial For Beginners | Create Your First Dashboard Now (Practice Files included)
 0:04:44
How to Visualize Data in the KIDS COUNT Data Center
 0:02:19
How to Visualize Data with Spreadsheets
 0:17:08
Visualize ANYTHING Using CHARTS in ChatGPT! (Data Analysis)
 0:40:05
How to visualize graph data from any source
 1:05:49
How to Visualize Your Data with Federica Fragapane | Domestika English
 0:02:11
How to Visualize Data with JavaScript
 0:06:43
Visualize Graph Data in Power BI
 0:07:33
Excel 2016 Visualize data in 3d maps
 0:01:40
How to visualize data in BigQuery in Data Studio
 0:03:32
How to Visualize Data for Your Area on data.census.gov
 0:00:25
How to visualize data trends using Sparklines. ✨ #excel #analyze #data
 0:01:21
How to Visualize Your Data in PowerPoint Design || ICONIC ACADEMY
 0:02:29
How to visualize Google BigQuery data in GraphXR
 0:04:20
How to visualize data with different chart types | PowerMetrics Tutorial
Комментарии