filmov
tv
MULTIPLE REGRESSION with Excel – How to predict the output based on multiple numerical variables!

Показать описание
Multiple Regression with Excel - How to predict the output based on multiple numerical variables!
If you've ever wondered how to predict something based on multiple factors - like figuring out how selling price and advertising cost affect your umbrella sales—you're in the right place! Multiple regression is a statistical technique used to understand the relationship between one dependent variable and two or more independent variables. In simple terms, it helps us see how several factors together influence a single outcome. In this video, you will learn:
• What is multiple regression?
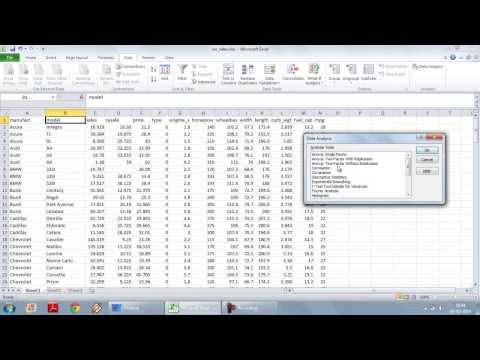
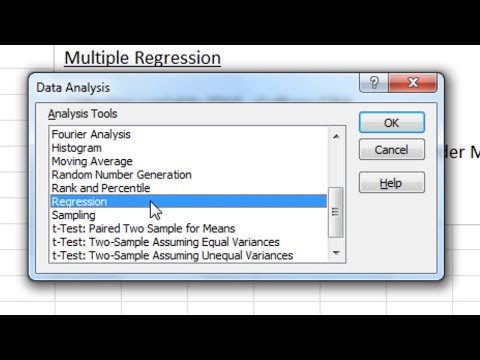
• How to install Analysis ToolPak in Excel?
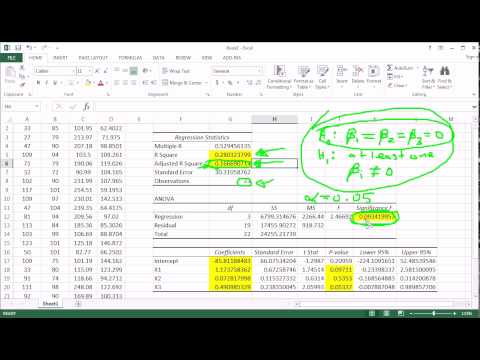
• How to create a multiple regression model, interpret it’s results, and make predictions with it?
Sounds interesting? Learn how to use it in this video!
Other related resources to this video:
~ How to use Simple Linear Regression for Prediction with Excel!
~ Multiple Regression with Excel - How to predict the output based on multiple numerical variables!
~ Multiple Regression in Excel Predict Results with Numerical & Non Numerical Data with TWO (2) Values!
~ Multiple Regression in Excel - Predict Results with Numerical & Non-Numerical (Categorical) Data with THREE (3) Values!
~ How to create a CORRELATION MATRIX for STOCKS with EXCEL!
~ How to run DESCRIPTIVE STATISTICS with EXCEL!
~ How to run Sentiment Analysis with Microsoft Excel!
~ How to create a Word Cloud with Microsoft Word!
~ How to find the CORRELATION for DRINK SALES with EXCEL!
~ Getting started with Minitab
~ Descriptive Statistics with Minitab
~ Correlogram with Minitab
By Cedric Ng,
AUTHOR of International Best Sellers,
~ “Predictive HR Analytics, Text Mining & ONA with Excel” &
~ “IISS: Employee Experience & Engagement with Predictive Analytics”
If you've ever wondered how to predict something based on multiple factors - like figuring out how selling price and advertising cost affect your umbrella sales—you're in the right place! Multiple regression is a statistical technique used to understand the relationship between one dependent variable and two or more independent variables. In simple terms, it helps us see how several factors together influence a single outcome. In this video, you will learn:
• What is multiple regression?
• How to install Analysis ToolPak in Excel?
• How to create a multiple regression model, interpret it’s results, and make predictions with it?
Sounds interesting? Learn how to use it in this video!
Other related resources to this video:
~ How to use Simple Linear Regression for Prediction with Excel!
~ Multiple Regression with Excel - How to predict the output based on multiple numerical variables!
~ Multiple Regression in Excel Predict Results with Numerical & Non Numerical Data with TWO (2) Values!
~ Multiple Regression in Excel - Predict Results with Numerical & Non-Numerical (Categorical) Data with THREE (3) Values!
~ How to create a CORRELATION MATRIX for STOCKS with EXCEL!
~ How to run DESCRIPTIVE STATISTICS with EXCEL!
~ How to run Sentiment Analysis with Microsoft Excel!
~ How to create a Word Cloud with Microsoft Word!
~ How to find the CORRELATION for DRINK SALES with EXCEL!
~ Getting started with Minitab
~ Descriptive Statistics with Minitab
~ Correlogram with Minitab
By Cedric Ng,
AUTHOR of International Best Sellers,
~ “Predictive HR Analytics, Text Mining & ONA with Excel” &
~ “IISS: Employee Experience & Engagement with Predictive Analytics”
 0:06:33
 0:11:02
 0:12:34
 0:01:20
 0:18:49
 0:10:15
 0:03:03
 0:21:10
 0:13:55
 0:17:30
 0:09:41
 0:13:37
 0:28:10
 0:09:14
 0:05:05
 0:12:55
 0:10:01
 0:05:34
 0:07:15
 0:00:28
 0:03:21
 0:10:12
 0:12:16
 0:06:53