filmov
tv
16.5 Conditional Column - One Column in Power BI (Power Query) | Power BI Tutorial for Beginners

Показать описание
#pavanlalwani #powerquery #excel #dataanalytics
In this Power Query tutorial, you will learn how to work on a conditional column in Power BI without writing any code. With the conditional column feature, you can create if-else conditions similar to Excel formulas. Follow along as we demonstrate the process using practical examples. We have prepared an Excel file titled "6.4 Conditional Column" with four tables for your reference.
In the first example, we will focus on a single column. Suppose you have a table with customer names and their corresponding profits. If the profit exceeds 400, we want to label it as "High Profit." If the profit is below 200, it should be labeled as "Low Profit." For profits between 200 and 400, we want to assign the label "Average Profit." With Power Query, you can easily accomplish this task using button clicks, making it a simple and efficient solution.
To follow along, we'll import the Excel file into Power Query editor. Click on the "New Source" button in Power Query and select the Excel file titled "6.4 Conditional Column." Import all four tables from the file. In the Power Query editor, navigate to the table labeled "CC_1 Column" that contains the profit column.
To create the conditional column, go to the "Add Column" tab and select the "Conditional Column" option. Name the new column "Profit Status" and define your conditions. For profit greater than or equal to 400, label it as "High Profit." For profit less than or equal to 200, label it as "Low Profit." For all other values, label it as "Average Profit." Note that you can add or delete conditions as needed without writing any code manually.
Once you have set up the conditions, click "OK" to create the new column. To verify that the conditional column is working correctly, you can sort the profit column in ascending order. You will see that the values are categorized correctly based on the defined conditions.
If you need to make any modifications, simply go back to the Conditional Column settings and update the conditions accordingly. This feature provides a simple and intuitive way to manipulate your data without the need for complex coding.
We hope this tutorial has provided you with a clear understanding of how to use the conditional column feature in Power BI. Stay tuned for more Power Query tutorials! Don't forget to like, share, and subscribe to our channel for more helpful videos.
---------------------------------------------------------
💼 Invest in your future with our Power BI 2023 NEW Course at an incredible 50% discount:
📚 200+ MCQs to test your knowledge.
📝 20+ Assignments for hands-on practice.
🔍 11+ Case Studies for real-world insights.
💼 5+ Industry Projects to build your portfolio.
🎓 Course Completion Certificate for your resume.
💡 Tips & Tricks to boost your skills.
🔎 5+ Industry Datasets for practical learning.
Join thousands of professionals who have transformed their careers. Enroll now at 50% off!
You can also explore our Power BI DAX 2023 course and get a 360º understanding of DAX
Invest in yourself. Become a Power BI expert. The future is yours! 💼💪"
#datacleaning #businessintelligence #powerbi #excelfunctions
---------------------------------------------------------
Timestamps:
00:00:03 Power Query for Conditional Column 🔄
00:00:27 Setting High, Low, and Average Profit Criteria ✅
00:00:57 Applying Conditional Column in Power BI ✨
00:01:25 Importing Tables in Power Query 💻
00:01:55 Adding Conditional Column in CC_1 Table 📊
00:02:21 Setting Conditions for Profit Status 📈
00:02:51 Ready-Made Conditional Column Feature 🎚️
00:03:19 Verifying Conditional Column Results ✔️
00:03:45 Modifying Conditional Column 🔧
 0:00:29
Conditional Formatting in Excel | Highlight Marks Pass/Fail #shorts #excel
 0:11:04
Conditional Column in Power BI using Power Query You can do anything
 0:09:40
Excel Conditional Formatting with Formula | Highlight Rows based on a cell value
 0:16:03
Excel Power Query Tutorial - Add Conditional Column
 0:05:00
Replace Values Based on Condition (in a Single Step) in Power Query
 0:00:43
excel, Filter data by 'greater than of equal to' function
 0:04:24
Using If then statement to change cell fill color (sort of)
 0:06:43
Conditional Formatting in Excel Tutorial
 0:05:02
Advanced Conditional Formatting in Excel | Conditional Formatting in Excel
 0:09:05
Power Query Column Tricks: Custom, Conditional, Index & More| Add Column
 0:02:01
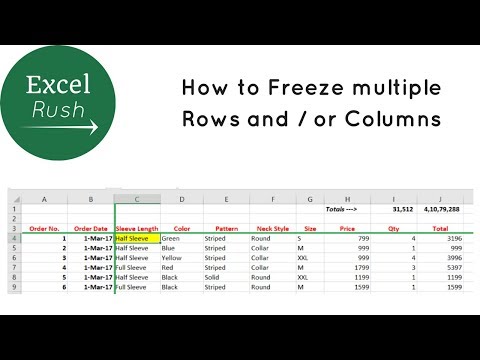
How to Freeze Multiple Rows and or Columns in Excel using Freeze Panes
 0:03:06
How to Find Minimum and Maximum Values in a Column Using Conditional Formatting || dptutorials
 0:03:23
Excel - Use Conditional Formatting on a Cell Based on Another Cell's Value
 0:08:03
Conditional Formatting: Highlight Rows Based On Another Cell's Value
 0:07:09
Conditional Statements: if p then q
 0:06:54
Excel Essentials -- Level UP! -- Conditional Formatting for Due Dates and Expiration Dates
 0:02:32
Approximate match equivalent of VLOOKUP Conditional column 39
 0:07:55
Become Excel Master With 7 Useful IF Formula Examples - Excel Formula and Functions - IF Function
 0:09:21
How To Get Red Color on Fail and Green Color On Pass Using Excel !!!
 0:00:56
How to use the SUMIF function in Microsoft Excel
 0:15:23
Excel IF Formula: Simple to Advanced (multiple criteria, nested IF, AND, OR functions)
 0:06:51
Apply Color Scales Conditional Formatting to Stock Returns in Excel
 0:01:00
Alternating row colors in Excel using conditional formatting and ISEVEN() - Excel Tips and Tricks
 0:00:56
Google Sheets Checkbox - Apply Conditional Formatting across entire row
Комментарии