filmov
tv
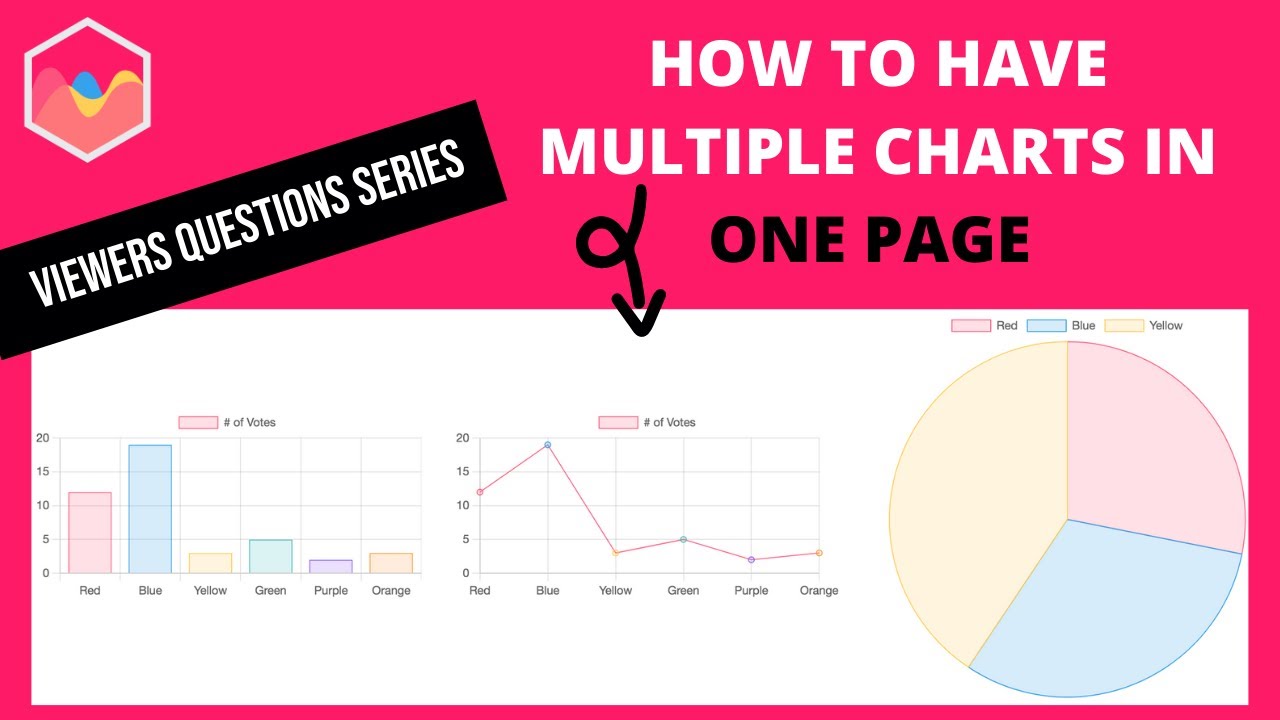
How to Have Multiple Charts in One Page With Chart JS
Показать описание
How to Have Multiple Charts in One Page With Chart JS
To display multiple charts in one page in Chart JS you need to understand how to draw a chart. We are working with canvas ID's which need to be unique. This means creating an unique ID for each chart.
This is a great topic to understand and we will use the chart blocks to combine data in keeping it dry.
▬ Materials/References ▬▬▬▬▬▬▬▬▬▬
To keep the video short we might expect you to know parts. These parts we have explained in other videos. You can find the references here below:
▬ Chartjs Viewers Question Series ▬▬▬▬▬▬▬▬▬▬
▬ Got a Question? Comment! ▬▬▬▬▬▬▬▬▬▬
Got a question or special request about a specific item? Comment below and tell me your question. I will make sure to follow up on you!
▬ Find Me Here ▬▬▬▬▬▬▬▬▬▬
Chart JS tutorials for Beginners:
Chart JS tutorials for Intermediate:
Chart JS Dashboard Series:
👍 Most Liked Video Series:
▬ About Us ▬▬▬▬▬▬▬▬▬▬▬▬
Why we created these #chartjs and #javascript video tutorials?
WHY
Creating charts in javascript is very rewarding but extremely challenging. The Chart JS library made it easier to render charts. However the chart js documentation is hard to understand for many. It requires a lot of different moving parts to work along. The canvas tag, javascript, arrays and Chart JS all need to be combined to draw an eye catching bar chart or line chart.
The videos explains the chart js documentation in a more visual and easy to understand way. You can follow along with the code and quickly grasp how it works. We cover the code in chart js but also what truly happens and why something happens when we write a line of code. This fundamental understanding gives clarity to you as a developer in chartjs. In short it is the Chart JS video documentation.
HOW
We answer questions from YOU (viewers) by creating an answer video that covers the questions YOU have posted in the comment section.
WHAT
Our goal is to help YOU learn how to draw charts in Chart JS by showing you in video format how to do it.
▬ Chart JS 3.4.1 ▬▬▬▬▬▬▬▬▬▬▬▬
Chart JS is a javascript library to draw charts in the canvas tag on your site. Presenting data in a visual manner such as charts is more effective and appealing. All the charts are always coded in the latest Chartjs version which is as of this recording Chart JS 3.4.1.
What type of charts can you make with Chart.JS?
With chart js you can make line chart, bar chart, pie chart, doughnut chart, scatter chart, polar area chart, radar chart, gauge chart and area chart. And with some clever tricks and visual adjustment more can be done.
 0:00:32
How to use Multiple Charts and All Indicators for Free | TradingView | TradingLead
 0:05:16
How To View Multiple Charts On TradingView
 0:01:25
How To Have Multiple Charts on Tradingview (2025 Updated Tutorial)
 0:00:59
Why Traders Should Use Multi-Chart Layouts
 0:05:03
TopstepX - 5 Mins or Less | Multiple Charts
 0:01:00
How to use multiple charts at once!
 0:01:07
HOW TO HAVE MULTIPLE CHARTS ON TRADINGVIEW (TUTORIAL UPDATED) 2025
 0:02:03
How to Have Multiple Charts on Tradingview 2025 (Full Tutorial)
 0:18:00
Offset Function in Excel | Detailed Explanation | Excel Dashboards | Excel Charts | Excel Tutorial
 0:01:35
How To Have Multiple Charts on Trading View
 0:00:48
How To Have Multiple Charts On Tradingview (2024)
 0:01:15
How To Have Multiple Charts On TradingView - Full Guide
 0:03:36
How To Compare Assets | Overlaying Charts In TradingView
 0:03:00
Thinkorswim Multiple Charts Multiple Monitors in TOS
 0:03:57
How to Sync Charts on TradingView
 0:00:49
Mastering Multiple Charts
 0:01:02
How to Have Multiple Charts on Tradingview
 0:04:29
How to quickly make multiple charts in excel
 0:01:48
Can I view multiple charts simultaneously on TradingView?
 0:10:03
Utilizing the Grid for Multiple Charts in ThinkorSwim
 0:00:15
Easy Way To Create And Add Data To Graph
 0:01:59
How to open Multiple Charts on a Single Screen?
 0:00:11
Add data to chart in excel #exceltips #exceltutorials #charts
 0:02:33
How To Have Multiple Charts on TradingView (2023)
Комментарии