filmov
tv
Wednesday Webinar: Monitoring Measures Using FIWARE and Grafana

Показать описание
FIWARE Wednesday Webinar - Monitoring Measures Using FIWARE and Grafana (10 February 2021)
Visualisation of data is key to understanding trends and this webinar discusses how to analyse context data using common open source tools.
With visualisation components such as Grafana, minor changes to default look-and-feel can really help to improve customer satisfaction. After all, the customer is always right. Co-presenting at our webinar on Monitoring Measures Using FIWARE and Grafana we will have a developer who makes changes such as these for a living – Germán Molina Carrasco from HOPU will be demonstrating some real-life FIWARE-Grafana tweaks and customisations they have created which have already reached paying clients.
0:00 Introduction
3:13 What is Grafana
7:55 Deep Dive: Filling Station Dashboard
24:27 HOPU: Real-life Use Cases
44:33 Summary
Speaker: Jason Fox (Senior Technical Expert and Evangelist, FIWARE Foundation) and Germán Molina Carrasco (Full-stack Developer, HOPU)
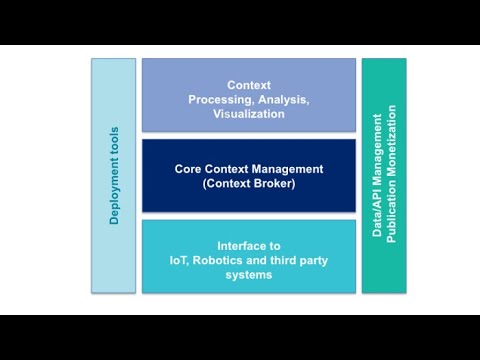
Chapter: Core-Context
Difficulty: 3
Audience: Any Technical
Visualisation of data is key to understanding trends and this webinar discusses how to analyse context data using common open source tools.
With visualisation components such as Grafana, minor changes to default look-and-feel can really help to improve customer satisfaction. After all, the customer is always right. Co-presenting at our webinar on Monitoring Measures Using FIWARE and Grafana we will have a developer who makes changes such as these for a living – Germán Molina Carrasco from HOPU will be demonstrating some real-life FIWARE-Grafana tweaks and customisations they have created which have already reached paying clients.
0:00 Introduction
3:13 What is Grafana
7:55 Deep Dive: Filling Station Dashboard
24:27 HOPU: Real-life Use Cases
44:33 Summary
Speaker: Jason Fox (Senior Technical Expert and Evangelist, FIWARE Foundation) and Germán Molina Carrasco (Full-stack Developer, HOPU)
Chapter: Core-Context
Difficulty: 3
Audience: Any Technical
 0:32:32
Wednesday Webinar: Introduction to FIWARE
 0:34:46
Wednesday Webinar: Short Term History within Smart Systems
 0:25:54
SICK Dusthunter Particulate Monitoring Webinar
 1:02:37
10 Best Practices for Electrosurgical Testing | TechNation Webinar Wednesday Series
 0:26:00
Live Cell Imaging Webinar | How to track and quantify cell movement
![[WEBINAR] How to](https://i.ytimg.com/vi/NW7B7fvd494/hqdefault.jpg) 0:43:50
0:43:50
[WEBINAR] How to Build a World Class Monitoring Strategy
 2:12:02
Webinar COVID-19 - Epidemiological monitoring and measurement of infectivity rates in key countries
 0:54:25
Webinar 'Monitoring Made Easy'
 0:58:12
Views from Above and Below: Supporting Sustainability with Earth Observations
 0:58:32
WEBINAR | Environmental Monitoring – Smart Environmental Monitoring Programs
 0:23:06
DROPLETS WEBINAR | Droplet size, uniformity control & detection, by Remigijus Vasiliauskas, PhD
 0:52:05
Flocksy & Finch Webinar Session 5: Using insights & data to monitor, measure and grow
 1:42:31
Impact Monitoring, Evaluation & Learning | ATBN Online Webinar
 1:04:08
Remote Monitoring Strategies & Solutions Webinar
 0:56:05
Webinar Wednesday: Stability Studies in Pharmaceutical and Personal Care Products
 0:58:56
Best Practice Webinar: How to combine vibration monitoring with other sensor technologies
 0:44:36
Dräger Webinar: Wireless Patient Monitoring -- is Wi-Fi Safe and Reliable?
 0:45:50
CQC Monitoring approach webinar (Hospitals)
 1:54:20
Webinar: Learning cities' COVID-19 recovery: Measurement, planning, evaluation. 8 July 2020
![[Webinar] Best Practices](https://i.ytimg.com/vi/sGs1MIgaUGk/hqdefault.jpg) 0:38:04
0:38:04
[Webinar] Best Practices for Monitoring Your Team's Work
 0:54:56
Why is it vital to test vital signs? Webinar
 0:55:25
Live Webinar: Which type of vibration sensor to use?
 0:24:33
Monitoring of circulating CAR T cells [WEBINAR]
 0:44:29
Webinar - VevoStrain Software in Action
Комментарии