filmov
tv
How To Create A Line Graph With Multiple Lines In Excel (Quick and Easy)

Показать описание
Learn how to create a line graph with multiple lines in Excel. First, we’ll be going through how to create a line graph with two lines in a quick and easy way. Then we’ll be talking about how to add or remove lines from the graph to have the exact number of lines you need. Shall we start?
Watch next video tutorial:
How to Add Chart Elements in Excel
How to visualize data in Excel
How to Make a Graph In Excel
================
❤️ Become a Patron:
Do you find our tutorials useful? Join this channel and become a patron
================
⏱️Timestamps⏱️
0:00 - How To Create A Line Graph With Multiple Lines In Excel
1:10 - How to Add an Additional Line to Your Line Graph
2:15 - How to Hide and Show Lines in Your Line Graph
2:48 - How to Edit or Remove Lines from Your Line Graph
3:39 - How to Customize the Appearance of Your Line Graph
================
Is this your first time on EasyClick? We’ll be more than happy to welcome you in our online community. Hit that Subscribe button and join the EasyClickers! :)
Got Microsoft Office 365? Get it here
Connect:
Screen Recorder & Video Editor:
#MicrosoftExcel #ExcelQuickAndEasy #EasyClickAcademy
 0:02:01
How to Create Line Account from Your Mobile
 0:01:01
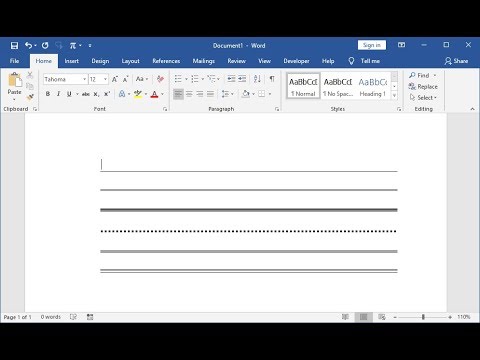
How to Create a Long Line in Microsoft Word : Tech Vice
 0:02:26
How to Create a LINE Account 2022 | LINE App Sign Up
 0:04:07
How to Create a LINE Account 2024 | LINE App Sign Up
 0:01:08
How to Create LINE ID | Set Up LINE ID on LINE Account
 0:01:56
How to Draw Straight Lines Vertical & Horizontal in MS Word (2003-2016)
 0:00:26
How to create Line Art in Blender in 1 Minute
 0:00:18
How to create Single Line Strokes from text in Illustrator
 0:32:01
How to create a watercolour line & wash of Robin Hood's Bay
 0:01:35
Shortcut Key to Draw Straight Lines in MS Word (Word 2003-2019)
 0:00:40
How to create a line graph with line for Total Sum of other lines in Tableau
 0:02:05
How to create a Line Chart in Excel
 0:01:11
How to Create Line Account Without Phone Number (2024)
 0:00:41
Create Animated Line Motion Graphics in After Effects
 0:00:36
How to create a line chart
 0:02:46
How to create LINE CHART/LINE GRAPH in EXCEL (Step by Step)
 0:02:12
How to Create A Line Graph on Word
 0:03:15
Create A LINE Account 2021 | Line.me Registration Help | LINE App Sign Up
 0:04:31
How To Create Line Account Without Phone Number (2024)
 0:02:13
How to Create Number Line in Microsoft Word
 0:01:53
How To Create A Line Chart In Canva | Canva Tutorial
 0:08:42
Create Abstract Line - Adobe Illustrator Tutorial
 0:02:49
How to create Line Chart to compare Sales of Multiple Years in PowerBI | MI Tutorials
 0:02:44
How To Create Number Line In Microsoft Word
Комментарии