filmov
tv
Finding Quartiles and the Interquartile Range of Data | Statistics, IQR

Показать описание
How do we find the quartiles and the interquartile range of a set of data? We'll be going over that with an example in today's statistics video lesson! #Statistics #APStats
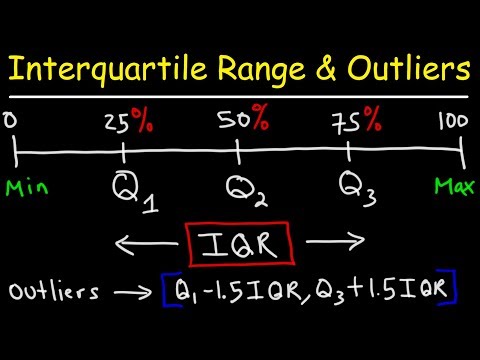
Finding the first quartile, second quartile, and third quartile of a data set is easy, but it can be time consuming. First, we have to order our data from least to greatest, then we can find the median of the data - the middle value - which is the second quartile, often written as Q2. Then we just find the median of all the data below Q2, which gives us Q1. Then we find the median of all the data above Q2, which gives us Q3. We have then split the data into four parts: the data less than Q1, the data between Q1 and Q2, data between Q2 and Q3, and data above Q3.
We can subtract Q1 from Q3 to find the "interquartile range". So Q3 - Q1 equals the interquartile range or IQR. This is a measure of how spread out the data is around the middle. If the interquartile range is very large then the middle 50% of the data is very spread out.
SOLUTION TO PRACTICE PROBLEM:
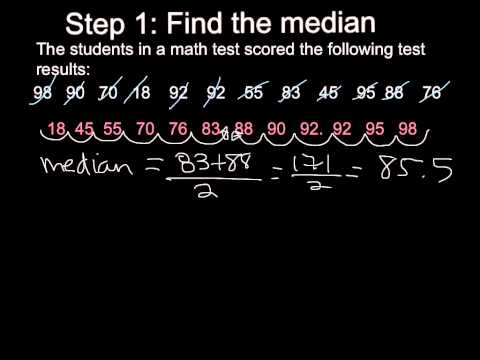
First we sort the salaries from least to greatest, giving us this list:
28,000 ; 33,000 ; 42,000 ; 54,000 ; 54,000; 64,500 ; 68,500 ; 69,000 ; 72,000 ; 120,000
Then, the median is the average of the middle two values, the average of 54,000 and 64,500 which is (54,000 + 64,500) / 2 = 59,250. This is Q2.
Then, 28,000 ; 33,000 ; 42,000 ; 54,000 ; 54,000 is the list of data below Q2 - the lower half of data. The median of this data is 42,000 - thus Q1 is 42,000.
Finally, 64,500 ; 68,500 ; 69,000 ; 72,000 ; 120,000 is the list of data above Q2 - the upper half of data. The median of this data is 69,000 - thus Q3 is 69,000.
Lastly, the interquartile range is Q3 - Q1 = 69,000 - 42,000 = 27,000.
I hope you find this video helpful, and be sure to ask any questions down in the comments!
********************************************************************
The outro music is by a favorite musician of mine named Vallow, who, upon my request, kindly gave me permission to use his music in my outros. I usually put my own music in the outros, but I love Vallow's music, and wanted to share it with those of you watching. Please check out all of his wonderful work.
********************************************************************
+WRATH OF MATH+
Follow Wrath of Math on...
Finding the first quartile, second quartile, and third quartile of a data set is easy, but it can be time consuming. First, we have to order our data from least to greatest, then we can find the median of the data - the middle value - which is the second quartile, often written as Q2. Then we just find the median of all the data below Q2, which gives us Q1. Then we find the median of all the data above Q2, which gives us Q3. We have then split the data into four parts: the data less than Q1, the data between Q1 and Q2, data between Q2 and Q3, and data above Q3.
We can subtract Q1 from Q3 to find the "interquartile range". So Q3 - Q1 equals the interquartile range or IQR. This is a measure of how spread out the data is around the middle. If the interquartile range is very large then the middle 50% of the data is very spread out.
SOLUTION TO PRACTICE PROBLEM:
First we sort the salaries from least to greatest, giving us this list:
28,000 ; 33,000 ; 42,000 ; 54,000 ; 54,000; 64,500 ; 68,500 ; 69,000 ; 72,000 ; 120,000
Then, the median is the average of the middle two values, the average of 54,000 and 64,500 which is (54,000 + 64,500) / 2 = 59,250. This is Q2.
Then, 28,000 ; 33,000 ; 42,000 ; 54,000 ; 54,000 is the list of data below Q2 - the lower half of data. The median of this data is 42,000 - thus Q1 is 42,000.
Finally, 64,500 ; 68,500 ; 69,000 ; 72,000 ; 120,000 is the list of data above Q2 - the upper half of data. The median of this data is 69,000 - thus Q3 is 69,000.
Lastly, the interquartile range is Q3 - Q1 = 69,000 - 42,000 = 27,000.
I hope you find this video helpful, and be sure to ask any questions down in the comments!
********************************************************************
The outro music is by a favorite musician of mine named Vallow, who, upon my request, kindly gave me permission to use his music in my outros. I usually put my own music in the outros, but I love Vallow's music, and wanted to share it with those of you watching. Please check out all of his wonderful work.
********************************************************************
+WRATH OF MATH+
Follow Wrath of Math on...
 0:03:23
How to Find the Interquartile Range of a Set of Data | Statistics
 0:12:33
How To Find The Interquartile Range & any Outliers - Descriptive Statistics
 0:07:34
Interquartile Range (IQR) | Math with Mr. J
 0:04:55
Finding Q1,Q3, and IQR ( Interquartile Range)
 0:03:53
What Are And How To Calculate Quartiles, The Interquartile Range, IQR, And Outliers Explained
 0:12:10
Finding Quartiles and the Interquartile Range of Data | Statistics, IQR
 0:09:23
Finding Quartiles Quick and Easy
 0:05:38
Quartiles & Interquartile Range
 0:11:46
Quartiles | Lower Quartile, Median, and Upper Quartile | Math with Mr. J
 0:03:46
Quartiles and Interquartile Range
 0:00:52
How to compute the lower, median, & upper quartile #shorts
 0:06:12
How to calculate interquartile range IQR | Data and statistics | 6th grade | Khan Academy
 0:04:30
Statistics Grade 10: Quartiles
 0:16:00
Box Plots and Quartiles - GCSE Higher Maths
 0:04:15
Median and interquartile range of cumulative frequency graph
 0:07:43
How to Calculate Interquartile Range ? | What are Quartiles and InterQuartile Range (IQR) ?
 0:09:28
Reviewing Quartiles & Interquartile Range
 0:07:14
Find the Interquartile Range with Even Data Set | Statistics
 0:15:37
Median, Quartiles and interquartile range : ExamSolutions
 0:00:38
quartiles and interquartile range calculation with #scientificcalculator #igcsemath
 0:09:42
Quartiles from a List - Corbettmaths
 0:00:36
How to Use Excel Quartile Function
 0:04:30
Find the Median, Lower Quartile, and Upper Quartile
 0:08:14
Grade 12 Mathematical Literacy: Data Handling | Quartiles 2022 | Interquartile Range
Комментарии