filmov
tv
How to set asp net chart control ChartType property dynamically

Показать описание
Text version of the video
Healthy diet is very important both for the body and mind. If you like Aarvi Kitchen recipes, please support by sharing, subscribing and liking our YouTube channel. Hope you can help.
Slides
ASP.NET Charts Playlist
All ASP .NET Chart Control Text Articles and Slides
All Dot Net and SQL Server Tutorials in English
All Dot Net and SQL Server Tutorials in Arabic
There are 2 ways to set the ChartType property
1. Declaratively in the HTML using ChartType attribute as shown below.
[Series]
[asp:Series Name="Series1" ChartArea="ChartArea1" ChartType="Pie"]
[Points]
[asp:DataPoint AxisLabel="Mark" YValues="800,0,0,0,0,0" /]
[asp:DataPoint AxisLabel="Steve" YValues="900,0,0,0,0,0" /]
[asp:DataPoint AxisLabel="John" YValues="700,0,0,0,0,0" /]
[asp:DataPoint AxisLabel="Mary" YValues="900,0,0,0,0,0" /]
[asp:DataPoint AxisLabel="Ben" YValues="600,0,0,0,0,0" /]
[/Points]
[/asp:Series]
[/Series]
2. Programatically in code. We want to display all the different ChartTypes available in a DropDownList. When the user selects an option from the DropDownList we want to set the selected chart type as the value for the ChartType property dynamically in code.
[div style="font-family:Arial"]
[table style="border: 1px solid black"]
[tr]
[td]
[b]Select Chart Type :[/b]
[/td]
[td]
[asp:DropDownList ID="ddlChartType" runat="server" AutoPostBack="True"
onselectedindexchanged="ddlChartType_SelectedIndexChanged"]
[/asp:DropDownList]
[/td]
[/tr]
[tr]
[td colspan="2"]
[asp:Chart ID="Chart1" runat="server" Width="350px"]
[Titles]
[asp:Title Text="Total marks of students"]
[/asp:Title]
[/Titles]
[Series]
[asp:Series Name="Series1" ChartArea="ChartArea1" ChartType="Pie"]
[Points]
[asp:DataPoint AxisLabel="Mark" YValues="800,0,0,0,0,0" /]
[asp:DataPoint AxisLabel="Steve" YValues="900,0,0,0,0,0" /]
[asp:DataPoint AxisLabel="John" YValues="700,0,0,0,0,0" /]
[asp:DataPoint AxisLabel="Mary" YValues="900,0,0,0,0,0" /]
[asp:DataPoint AxisLabel="Ben" YValues="600,0,0,0,0,0" /]
[/Points]
[/asp:Series]
[/Series]
[ChartAreas]
[asp:ChartArea Name="ChartArea1"]
[AxisX Title="Student Name"]
[/AxisX]
[AxisY Title="Total Marks"]
[/AxisY]
[/asp:ChartArea]
[/ChartAreas]
[/asp:Chart]
[/td]
[/tr]
[/table]
[/div]
 0:03:35
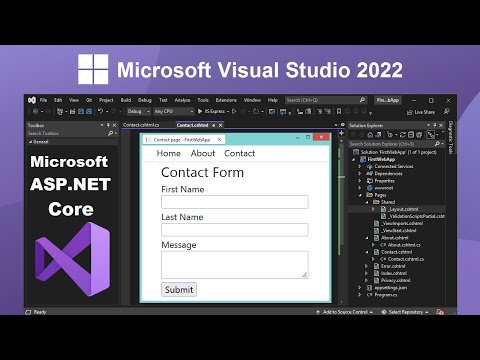
Create ASP.NET Project using Microsoft Visual Studio 2022 | Amit Thinks
 1:00:44
ASP.NET Core Crash Course - C# App in One Hour
 0:02:40
Create Asp.Net Web Application in Visual Studio 2022 with Installation
 0:15:16
Managing your .NET app configuration like a pro
 0:11:33
ASP NET Core appsettings json file
 0:53:26
ASP.NET 8 MVC Tutorial for Beginners - C# web development made easy
 0:18:11
CREATE and CONNECT DATABASES in ASP.NET
 0:05:54
Create Your First ASP.NET Web Application using Visual Studio Code | ASP.NET using VSCode and .NET 8
 0:12:32
Build a RESTful API in ASP.NET 6.0 in 9 Steps!
 0:07:14
How to install Visual Studio 2022 for ASP.NET
 0:11:07
Create ASP.NET Core Web Application using Visual Studio 2022
 0:03:27
ASP.NET - Web Configuration
 0:04:31
Configure ASP.NET Core with a .ENV file!
 0:10:12
ASP.NET Core Web API Features You Need to Know In 10 Minutes or Less
 0:14:26
ASP.NET Localization - Adding a multilanguage content system
 2:12:31
ASP.NET Core MVC Course for Beginners (.NET 9)
 0:00:28
Configure Token Based Authentication in ASP.NET Core
 1:09:00
How to Build an ASP.NET Core MVC Web App – Tutorial
 0:21:17
ASP.NET - Validation Controls
 0:06:09
Deploy ASP.Net Core Web Application in IIS - Dot Net Core Hosting
 0:53:30
ASP.NET Web API CRUD Operations - .NET8 and Entity Framework Core Tutorial
 0:07:30
Send Emails in C# and ASP.NET Core! - It´s actually pretty SIMPLE!
 0:08:59
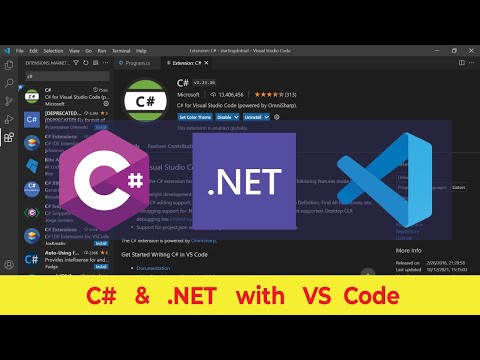
C# and .Net in Visual Studio Code ( vscode ) | Set up and Installation Guide | 2023 | IAmUmair
 0:02:53
How to create the asp.net core application in vs code
Комментарии