filmov
tv
Stem & Leaf Plots and Histograms (Back-To-Back)

Показать описание
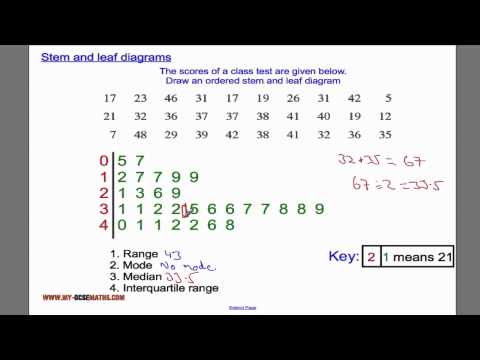
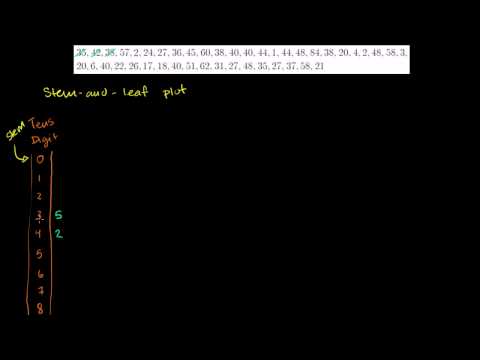
This video demonstrates how to construct a back-to-back Stem and Leaf Plot when given two sets of data. It then shows how to draw a back-to-back Histogram (bar graph) when given two sets of data.
 0:07:47
 0:05:11
 0:04:46
 0:01:02
 0:06:23
 0:07:42
 0:05:58
 0:12:40
 0:07:50
 0:06:45
 0:02:07
 0:14:08
 0:05:36
 0:02:14
 0:04:28
 0:06:01
 0:05:18
 0:02:03
 0:00:26
 0:02:54
 0:09:22
 0:07:49
 0:13:53
 0:03:18