filmov
tv
How To Trade Candles Patterns | Strategy Backtest In Python

Показать описание
In this informative video, we will explore the power of price action patterns in combination with Bollinger Bands for trading strategy backtesting. Specifically, we will delve into the Doji and Engulfing price action patterns, two of the most reliable and effective patterns in technical analysis. Through the use of Python, we will analyze historical market data and test our strategy's performance using various parameters.
Bollinger Bands, a popular technical indicator, provide a visual representation of volatility by displaying the standard deviation of price movement around a moving average. When used in conjunction with price action patterns like the Doji and Engulfing, we can identify key areas of support and resistance and make informed trading decisions.
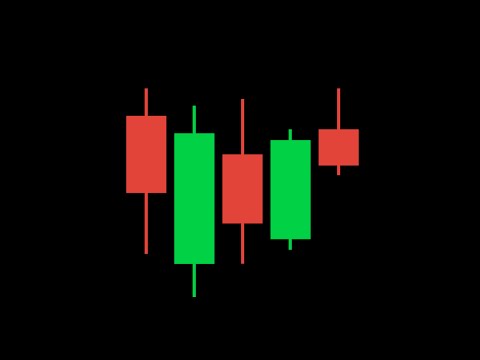
The Doji pattern occurs when the opening and closing price of an asset are almost identical, creating a small-bodied candlestick. This pattern signals indecision in the market and can provide a potential reversal signal when combined with other indicators like Bollinger Bands.
The Engulfing pattern, on the other hand, occurs when a small candlestick is followed by a larger candlestick that completely engulfs the previous candle. This pattern indicates a strong shift in momentum and can be a signal to enter or exit a trade.
Using Python, we will backtest our trading strategy and evaluate its performance based on metrics like the win rate, profit factor, and maximum drawdown. By testing different parameters, we can optimize our strategy for maximum profitability and minimize risk.
Overall, this video is a must-watch for any trader interested in combining Bollinger Bands with price action patterns like the Doji and Engulfing for a winning trading strategy. With Python, we can automate our analysis and testing process and gain valuable insights into market behavior that can lead to profitable trades.
Good luck and thank you for following!
💲 Discount Coupon for My Course on Algorithmic Trading (Check my About page for other coupons and more courses):
You can download the python notebook with the following link:
#trading #algorithmictrading #forex #tradingstrategy #backtesting
Bollinger Bands, a popular technical indicator, provide a visual representation of volatility by displaying the standard deviation of price movement around a moving average. When used in conjunction with price action patterns like the Doji and Engulfing, we can identify key areas of support and resistance and make informed trading decisions.
The Doji pattern occurs when the opening and closing price of an asset are almost identical, creating a small-bodied candlestick. This pattern signals indecision in the market and can provide a potential reversal signal when combined with other indicators like Bollinger Bands.
The Engulfing pattern, on the other hand, occurs when a small candlestick is followed by a larger candlestick that completely engulfs the previous candle. This pattern indicates a strong shift in momentum and can be a signal to enter or exit a trade.
Using Python, we will backtest our trading strategy and evaluate its performance based on metrics like the win rate, profit factor, and maximum drawdown. By testing different parameters, we can optimize our strategy for maximum profitability and minimize risk.
Overall, this video is a must-watch for any trader interested in combining Bollinger Bands with price action patterns like the Doji and Engulfing for a winning trading strategy. With Python, we can automate our analysis and testing process and gain valuable insights into market behavior that can lead to profitable trades.
Good luck and thank you for following!
💲 Discount Coupon for My Course on Algorithmic Trading (Check my About page for other coupons and more courses):
You can download the python notebook with the following link:
#trading #algorithmictrading #forex #tradingstrategy #backtesting
 0:11:45
The ONLY Candlestick Pattern Guide You'll EVER NEED
 0:53:16
Ultimate Candlestick Patterns Trading Course (PRO INSTANTLY)
 0:14:33
How to trade the best Candlestick patterns - 7 entries
 0:58:21
The Only Candlestick Patterns Trading Video You Will Ever Need... (Beginner To Advanced)
 0:00:47
The Common MISTAKE Traders Make With Doji Candles #Shorts
 0:09:28
Best Candlestick Patterns (GET BETTER ENTRIES)
 0:38:15
Ultimate Chart Patterns Trading Course (EXPERT INSTANTLY)
 0:38:11
The Ultimate Candlestick Patterns Trading Course (For Beginners)
 0:43:33
Custom Candlestick Pattern for Finding Flags | Trading Flag Patterns | Ben Watson | 9-24-24
 0:01:00
Candlestick Charts: Explained in 60 Seconds!
 1:17:35
The Only Technical Analysis Video You Will Ever Need... (Full Course: Beginner To Advanced)
 0:06:54
Best Candle Formation for 5 Minute Scalping
 0:43:04
Free Complete Candlestick Patterns Course | Episode 1 | All Single Candlesticks | Technical Analysis
 0:00:06
Candle Patterns Representation @ChartPatterns #trading #forex #crypto
 0:00:57
The best candlestick patterns you must know
 0:13:55
Mastering Candlestick Patterns: A Basic Guide to Candles in Trading.
 0:13:53
Das einzige Candle Stick Pattern welches du zu 100% kennen musst...! (Hammer Candle/Shooting Star)
 0:43:20
Complete Candlestick Patterns Course | Episode 1 #TechnicalAnalysis Price Action
 0:05:39
How to Read Japanese Candlestick Charts?
 0:30:52
What is Candlestick Chart? Types of Candles Explained | Intraday Technical Analysis Basics Malayalam
 0:10:56
Candlestick Patterns CHEAT SHEET (UNIQUE Price Action Trading Strategy For Beginners)
 0:14:18
Candlestick Patterns Cheat Sheet (95% Of Traders Don't Know This)
 0:13:11
Best Candlestick Patterns (That Work)
 0:01:00
I Found A Trading Strategy With a 225% Profit Rate #shorts
Комментарии