filmov
tv
Earth System Science 1: Intro to ESS. Lecture 26. Why Climate Changes

Показать описание
UCI ESS 1: Introduction to Earth System Science (Fall 2013)
Lec 26. Introduction to Earth System Science -- Why Climate Changes --
View the complete course:
Instructor: Julie Ferguson, Ph.D.
License: Creative Commons CC-BY-SA
Description: Earth System Science covers the following topics: the origin and evolution of the Earth, atmosphere, oceans, perspective of biogeochemical cycles, energy use, and human impacts on the Earth system.
Recorded December 4, 2013.
 0:51:55
Class 1: The Earth System, Chapter 1 - Introduction
 0:04:33
Earth System Science
 0:05:41
What are Earth Systems?
 0:31:04
Earth Science Chapter 1 Lecture
 0:31:53
Earth Science: Lecture 1 - Introduction to Earth Science
 0:03:48
Master | Earth Sciences: Earth System Science (Track) | University of Amsterdam
 0:06:23
Department of Earth System Science, University of California, Irvine
 0:07:10
Earth Systems Intro for Elementary & Middle School NGSS 5-ESS2-1, 5-ESS2-2
 0:07:51
UND Aerospace Airport Tour
 0:41:33
Introduction to Earth Science (ESC-1000 & ES-105)
 0:07:41
Introduction to Geology
 0:02:46
Earth System Science with Dr. Matthew Long
 0:05:47
The Four Earth Systems
 0:07:47
The Earth System
 0:12:11
Earth's Systems and How they Work
 0:16:21
Earth's Four Spheres - Geosphere, Hydrosphere, Atmosphere and Biosphere
 0:57:53
Earth Science for Kids - Solar System, Weather, Fossils, Volcanoes & More - Rock 'N Learn
 0:06:04
Introduction of Earth System Science and Geology majors to prospective students
 0:04:12
Intro To Earth Science: Sec. 1: The Study of Earth Science
 0:07:03
Geology and Earth Systems Science
 0:03:39
Earth Science An Introduction
 0:42:13
Earth Science Chapter 1: Introduction to Earth Science
 0:17:53
THE PLANET EARTH | EARTH AND LIFE SCIENCE | SCIENCE 11 - MELC 1 & 2
 0:07:22
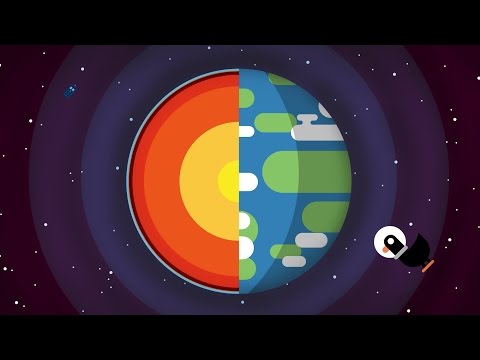
Everything You Need to Know About Planet Earth
Комментарии