filmov
tv
How to do a Paired Samples t Test in SPSS (11-7)

Показать описание
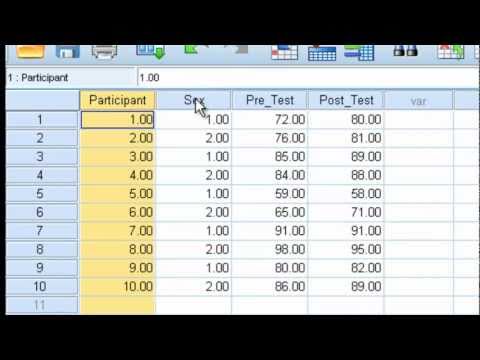
Using a dog training example, we compare two types of reinforcement training using a Paired Samples t-test. We work through the five steps of hypothesis testing, and conduct the Paired Samples t-test in SPSS. We compute Cohen’s d, we interpret the results, and write them up in proper APA style.
Because Cohen’s d effect size is susceptible to correlation between the group scores (this is true of any repeated measures design), we discuss for to use the Dunlap et al. (1996) correction formula for Cohen’s d. This correction is included in an Effect Size Calculator that you can download below.
This video teaches the following concepts and techniques:
Paired Samples t-test in SPSS
IBM SPSS Statistics software
Cohen’s d and the Dunlap correction for effect size
Link to a Google Drive folder with all of the files that I use in the videos including the Effect Size Calculator for t Tests and datasets. As I add new files, they will appear here, as well.
 0:07:50
06 Paired Samples t-Tests in SPSS – SPSS for Beginners
 0:07:10
Paired Samples T-Test (How to calculate and interpret)
 0:04:33
How To Do A Paired Stimulus Preference Assessment (PSPA)
 0:05:12
How to perform paired t test in Excel
 0:11:17
T-Tests: A Matched Pair Made in Heaven: Crash Course Statistics #27
 0:12:56
Matched or Paired Samples T-Test - Hypothesis Testing
 0:03:28
How To Perform A Paired T-Test In SPSS
 0:03:26
Paired T-Test Example Problem
 0:04:28
Paired Sample t-test
 0:06:47
How to perform paired t-test in Excel
 0:05:15
Paired Samples T Test in Stata
 0:03:35
How to Run a Paired Samples T Test in Spss
 0:04:07
How to do a Paired/Matched Sample T-Test
 0:05:47
R tutorial: Paired samples t test
 0:04:42
How To Do Paired Sample T-Tests in Microsoft Excel
 0:09:46
How to Run a Paired Samples t-test in Excel
 0:11:17
How to do a Paired Sample Hypothesis Test in Excel (t-test and z-test)
 0:07:17
One sample t-test vs Independent t-test vs Paired t-test
 0:06:33
How to do Paired T Test Excel
 0:08:34
An Introduction to Paired-Difference Procedures
 0:05:13
Paired-samples t-test — jamovi
 0:04:05
How to Use Excel-The t-Test-Paired Two-Sample for Means Tool
 0:09:44
How To... Calculate Student's t Statistic (Paired) by Hand
 0:01:01
How to perform Paired T test in excel without needing formula #excel #shorts
Комментарии