filmov
tv
How To Use ADX To Find Tops | Joe Rabil | Stock Talk (06.08.23)

Показать описание
Joe Rabil of Rabil Stock Research shows how ADX can help us identify topping patterns. Tops can take place in the form of a Climax or in the form of exhaustion or momentum loss. In this lesson, Joe explains how ADX can help to see both of these patterns. He then covers the stock symbol requests that came through this week.
00:00 Intro
01:33 Trading Lesson - Use ADX To Find Tops
11:08 Invesco QQQ (QQQ)
12:29 Dow Jones Industrial ETF (DIA)
13:40 United Rentals (UR), Amgen (AMGN), Apple (AAPL)
18:09 Alphabet (GOOGL), Adobe (ADBE), Netflix (NFLX)
21:33 Brookfield (BN), Royal Bank Of Canada (RY), Doximity (DOCS)
24:55 Builders FirstSource (BLDR)
Connect with Joe:
–––––
See what better financial charting can do for you!
FOLLOW US
ABOUT STOCKCHARTS
ABOUT STOCKCHARTS TV
DISCLAIMER
Past performance is not indicative of future results. Neither the Show Participants
risk of loss in following any strategy or investment discussed on the show.
Strategies or investments discussed may fluctuate in price or value.
Investments or strategies mentioned in this show may not be suitable for you and
you should make your own independent decision regarding them. This material
does not take into account your particular investment objectives, financial situation
or needs and is not intended as recommendations appropriate for you.
You should strongly consider seeking advice from your own investment advisor
 0:08:49
I TESTED a 92% Win Rate ADX Trading Strategy with an Expert Advisor - SURPRISING RESULTS 😲
 0:08:25
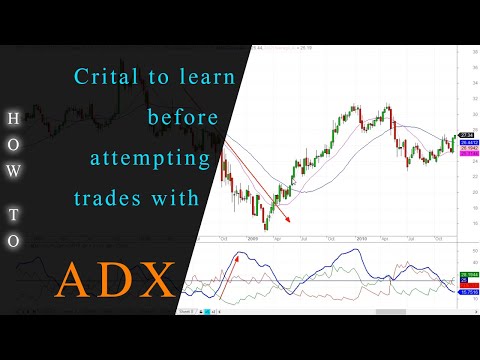
Learn this before attempting to trade using the ADX Indicator
 0:06:12
The BEST ADX Trading Strategy for Day Trading and Swing Trading. Super easy.
 0:03:24
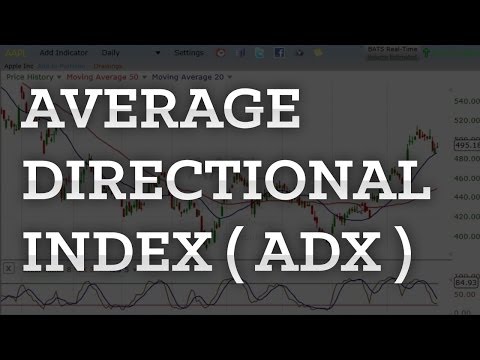
Average Directional Index (ADX) Explained Simply In 3 Minutes
 0:17:22
What is ADX Indicator? || Trading
 0:10:32
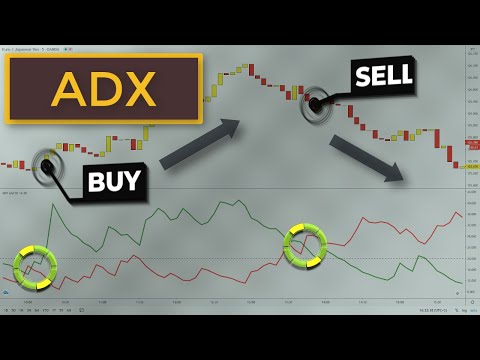
ADX DMI Day Trading Strategy | How To Use The ADX Indicator
 0:07:52
How to Use ADX to Identify Reversals in the Trend
 0:12:35
How To Use The ADX Indicator
 0:18:50
Top 15 Secret Trading Strategies Revealed
 0:15:29
ADX Indicator || The Breakout Secret || Avoid Sideways Market || Anish Singh Thakur || BoomingBulls
 0:21:57
DMI + ADX Indicator Mega Breakdown - Where To Get & How To Use!
 0:03:10
ADX indicator explained | 1 min Strategy | QUOTEX
 0:22:06
Secrets to Trend Trading with the ADX and Price Action
 0:03:57
How To Use ADX Indicator in Forex Trading
 0:13:00
How to Use The Average Directional Index (ADX) in Trading
 0:07:18
ADX Indicator Explained: Best ADX Trading Strategy
 0:11:27
MTF ADX Pattern: How to Use ADX to Anticipate a Breakout
 0:05:10
ADX and DMI Indicator for Trading: Best Strategies and Finding Trends
 0:15:11
Beginner’s Guide: How to Use ADX to Confirm Trend Direction (A-Z Guide)
 0:01:35
How to Use ADX Indicator to Identify Trend Strength
 0:04:54
ADX: A Step By Step Guide | Average Directional Index
 0:10:54
ADX - DI lines and How They Can Help Your Timing
 0:05:10
How to use the ADX (Average Directional Index) Indicator on MT4
 0:14:51
How to use the ADX Indicator (ADX/DMS) for profitable entries & exits?
Комментарии